AI Agents
 AI Copilot
 AI Actions
 AI ROI Calculator
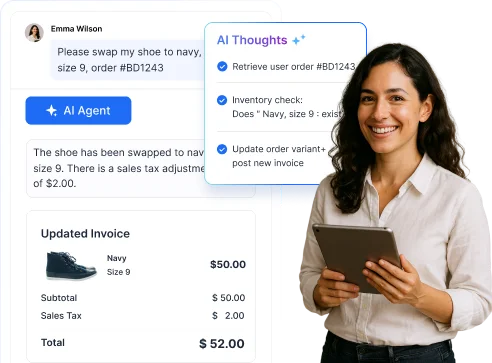


 SaaS
SaaS Insurance
 Telecom
 Healthcare
 Startups
 Fintech
 Email Ticketing System
 Shared Inbox Software
 Multi Brand Help Desk
 Internal Help Desk Software
 Trouble Ticketing Software
 Mobile Help Desk


 Blog
Blog


TL;DR:A support tooling ROI model shows how improvements in support operations translate into business value. It highlights how time saved, fewer escalations, and ticket deflection contribute to annualized savings, while realistic inputs keep the ROI credible for leadership and finance teams.
Support teams are under pressure to manage rising ticket volumes, meet SLAs, and improve customer experience without adding headcount. Tools and workflow upgrades can help, but most organizations won’t approve new spending without clear evidence of value
According to ServiceTarget, companies that invest in modern support tooling and knowledge-driven support programs can achieve 2–3× returns within 12 months, driven by lower support costs and improved customer retention.
A support tooling ROI model gives leaders a practical way to connect operational improvements to measurable business impact, such as faster resolutions and reduced manual work.
In this guide, you’ll learn how to use a simple support tooling ROI model to estimate the financial impact of help desk tools, automation, and workflow optimization.
What is a support tooling ROI model and how does it work?
A customer support tooling return on investment (ROI) model is a framework used to measure the value support tools generate compared to their cost.
It works by identifying measurable improvements in support operations, such as faster ticket resolution, fewer escalations, lower cost per ticket, or higher agent productivity and then converting those gains into financial value.
By converting time saved and reduced rework into monetary value, the model helps support teams justify investments using metrics leaders and finance teams can easily evaluate.
Why support teams need a clear support tooling ROI model
Support improvements often deliver real value, faster resolutions, fewer escalations, and improved customer service experience, but that value isn’t always easy to quantify.
According to Salesforce’s State of Service report, 88% of service teams say customer expectations for speed and efficiency are higher than ever.
Without a structured way to measure impact, it becomes difficult for leaders to evaluate new tools, compare improvement initiatives, or justify investments to finance teams.
A support tooling ROI model provides a consistent framework for translating operational improvements into measurable business outcomes, such as:
- Lower cost to serve: Your team spends fewer minutes per ticket, handles fewer reopens, and avoids unnecessary manual coordination.
- Fewer operational risks: Better visibility and more consistent workflows reduce SLA breaches, escalations, and unexpected workload spikes.
- Better decision‑making: You can compare options, like a new platform, workflow improvements, or targeted automation, using the same inputs, metrics, and evaluation criteria.
A structured ROI model helps keep your customer service business case trustworthy.
Key areas where support tooling generates ROI
Support tools improve more than just one customer service metric. The impact usually shows up across several parts of your support workflow, not just average handle time or cost per ticket.
Here are some of the most common areas where teams see ROI:
- Faster time to resolution (TTR): Better workflows, knowledge base suggestions, and a unified customer view help agents find answers faster and resolve tickets with fewer steps.
- Reduced ticket volume: Automation and self-service options deflect repetitive requests, which means fewer tickets entering the support queue.
- Lower cost per ticket: Consistent workflows, macros, and accurate automated ticket routing reduce rework and unnecessary handoffs.
- Higher CSAT and stronger retention: Faster and more accurate responses improve the customer experience and reduce the risk of customer churn.
- Higher agent productivity: When manual steps and back-and-forth transfers are reduced, agents can handle more tickets without sacrificing quality.
Together, these improvements make support operations more efficient and easier to scale.
They can then be translated into financial value using inputs like time saved, affected ticket volume, and fully loaded labor costs.
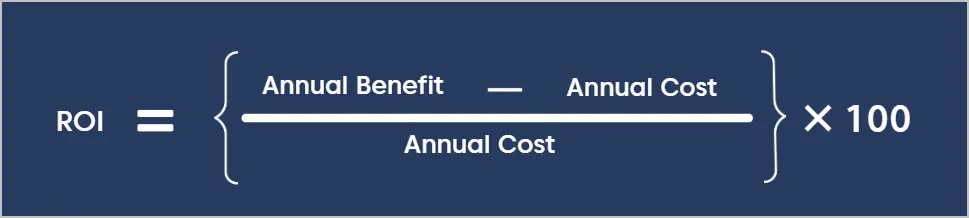
The simple support tooling ROI model formula
Below are the basic ROI formula and a clear explanation of what each part represents, so you can compare the value created to the cost of the tool.
Annual benefit: The total value your team gains from using the tool. This may include:
- Time saved per ticket
- Fewer escalations and reopens
- Productivity gains that delay hiring
Annual cost: The total yearly cost of owning and running the tool, including:
- Licenses or subscriptions
- Implementation costs
- Training and onboarding
The table below summarizes the performance metrics and the outcomes they influence in the ROI model:
| Metric | Expected impact |
| Resolution time | 15–35% faster |
| Ticket deflection | 10–30% |
| Agent productivity | 20–40% |
| Cost per ticket | 10–25% reduction |
Many teams include a brief note on non‑financial customer service ROI, like higher CSAT, better data quality, or stronger morale, to show the broader impact without complicating the core ROI calculation.
How to build a support tooling ROI model (step-by-step)
The ROI formula is straightforward. The real work is gathering reliable inputs such as time saved, ticket volume, and labor costs, so the calculation reflects real operational impact.
Use the steps below to estimate the financial value of support tools, automation, routing improvements, or workflow changes.
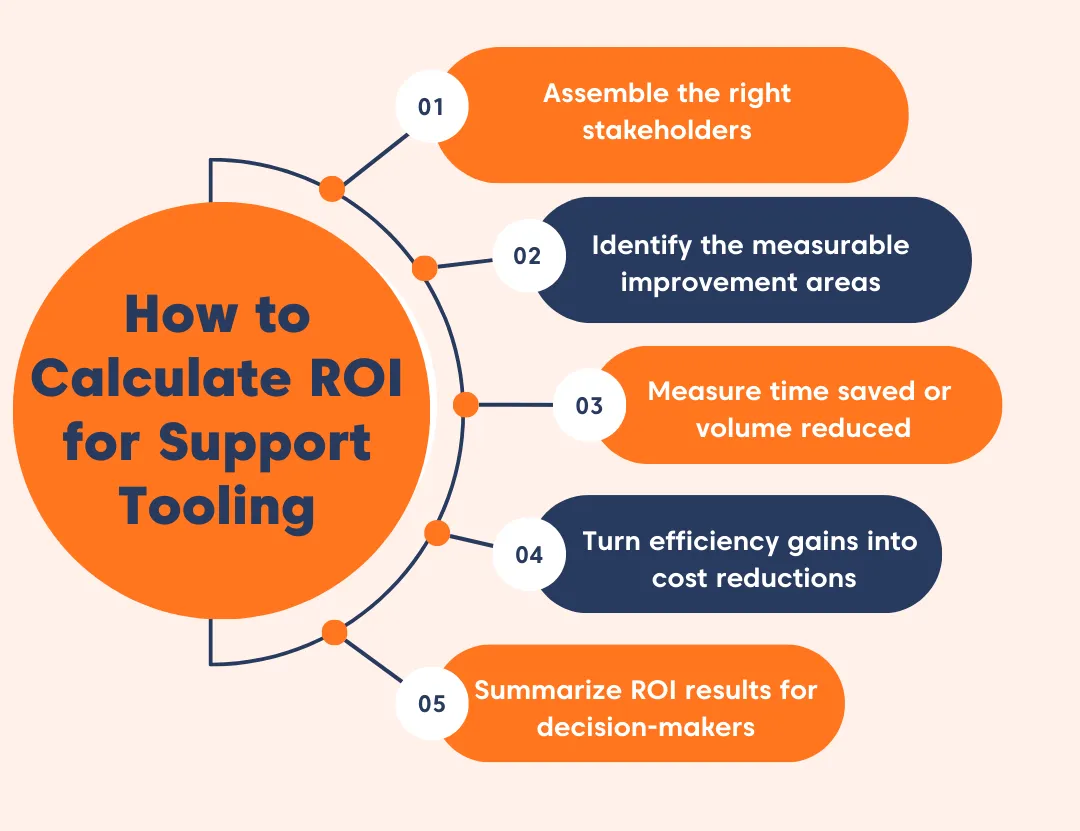
Assemble the right stakeholders
ROI models are easier to defend when the right teams are involved early. Bring in stakeholders who understand how support workflows operate and how costs are calculated.
Typical contributors include:
- Support operations or support lead: Validates ticket workflows, routing logic, and the time agents spend on common tasks.
- Finance or business operations: Provides fully loaded labor rates and confirms how cost savings should be calculated.
- Customer experience leadership: Helps evaluate the impact on SLAs, escalations, and customer satisfaction.
- Engineering (if needed): Advises on integrations, internal tooling, and automation feasibility.
- Data or analytics teams: Pull baseline metrics such as ticket volume, resolution time, and reassignment rates.
Identify the measurable improvement areas
Next, identify where the tool or workflow change is expected to create measurable improvements.
Focus on two to four clear ROI drivers so the model stays credible and easy to explain.
Common improvement areas include:
- Minutes saved per ticket (drafting replies, categorizing issues, routing tickets)
- Lower transfer or escalation rates
- Reduced ticket volume
- Fewer reopens or repeated interactions
Key takeaway:
Avoid vague benefits such as “improved efficiency.” Instead, connect each improvement to a measurable metric such as time saved, ticket volume reduced, or fewer handoffs.
Measure time saved or volume reduced
Once you’ve identified the improvement areas, estimate the potential impact using available data.
Common approaches include:
- Running a 2–4-week pilot before and after implementation
- Reviewing a sample of tickets by channel or issue type
- Using baseline metrics from your help desk platform reports
- Applying conservative estimates when uncertainty is high
Improvements in ticket triage are often the easiest to measure because most help desk ROI platforms already track reassignment and transfer rates.
Convert efficiency gains into cost savings
After estimating the improvements, translate those gains into cost impact.
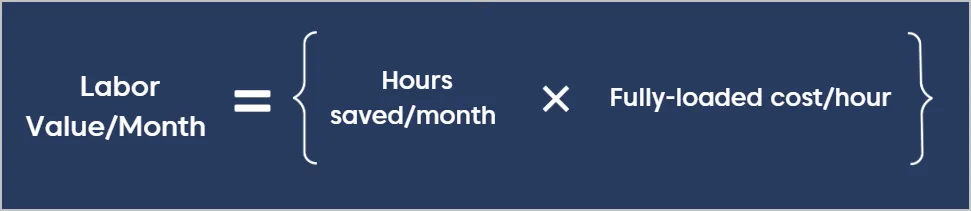
Start with a fully loaded hourly labor cost from finance. This should include salary, benefits, and overhead so the calculation reflects the true cost of support work.
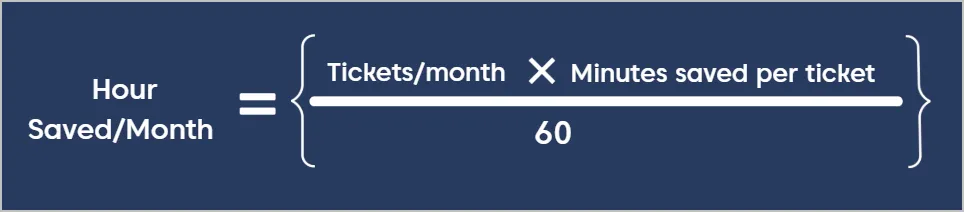
Step 1: Calculate hours saved per month
Step2: Calculate the final cost impact
Calculate the hours saved per month, then multiply those hours by the hourly labor cost to estimate the monthly value of the efficiency gain.
You may also account for additional measurable impacts such as:
- Escalations avoided
- Tickets deflected through automation or self-service
- Rework reduced through fewer reopens
Apply the ROI formula and summarize results
Once you estimate the total benefits and costs, apply the ROI formula to calculate the return.
Example:
A support team handles 12,000 tickets per month. After implementing improved routing, automation, and workflow tools, the team saves 2 minutes per ticket on average.
Assuming a fully loaded labor cost of $35 per hour:
Annual efficiency gains
- 12,000 tickets × 2 minutes saved = 24,000 minutes saved per month
- 24,000 minutes ÷ 60 = 400 hours saved per month
- 400 hours × $35/hour = $14,000 monthly value
- $14,000 × 12 = $168,000 annual benefit
Annual cost of the tool
- Software subscription: $30,000
- Implementation and onboarding: $10,000
- Total annual cost: $40,000
ROI calculation
- ROI = (Annual Benefit – Annual Cost) ÷ Annual Cost
- ROI = ($168,000 – $40,000) ÷ $40,000
- ROI = 3.2 (or 320%)
Highlighting the main value drivers helps leadership quickly understand the impact and evaluate the investment.
AI-Powered ROI Calculator for Support Teams
Calculate the ROI of your support tools in seconds. Estimate time savings, cost reductions, and efficiency gains—no spreadsheets needed.
Common mistakes that lead to misleading ROI estimates
ROI estimates can quickly become inaccurate when assumptions are unrealistic or when the same savings are counted more than once.
| Mistake that artificially inflate ROI | Why it’s a problem | How to stay credible |
| Counting the same minutes twice | Double counting inflates the ROI and is usually flagged by finance teams. | Use one method to calculate labor savings and treat staffing changes separately. |
| Using overly unrealistic inputs | Optimistic assumptions make the model difficult to trust. | Use data from pilots, reports, or ticket samples, and clearly note any uncertainty. |
| Assuming time saved automatically reduces costs | Time savings only reduce costs if headcount or workload changes. | Frame the benefit as added capacity, SLA protection, backlog reduction, or delayed hiring. |
| Including too many variables | A complex model becomes harder to explain and defend. | Start with a few measurable drivers and add more detail only when reliable data is available. |
Use a support tooling ROI model to guide smarter, data‑driven investments
Support tools deliver measurable value when teams track the right metrics, such as resolution time, ticket volume, rework, and avoided escalations, and convert those improvements into cost savings.
Use the ROI model in this guide to estimate the financial impact of tooling changes and refine your assumptions as processes evolve.
If you’re ready to turn these insights into results, BoldDesk brings together the tools support teams need to streamline workflows, improve efficiency, and drive measurable ROI.
Start a free trial or book a live demo to see how BoldDesk can help your team deliver measurable results.
Was this article helpful? Share your thoughts in the comments below.
Related articles
- 15 Best Help Desk Software in the Market Today
- How to Calculate and Reduce Customer Acquisition Cost
- Top 10 Customer Experience Metrics & KPIs to Measure Success
Frequently Asked Questions
ROI = (benefits − costs) ÷ costs. Estimate benefits by converting improvements such as time saved per ticket into labor cost savings, along with reductions in reopens and reassignments, using a conservative fully loaded hourly rate. Then compare those savings to subscription and implementation costs.
Businesses need monthly ticket volume, average handle time, and an hourly labor cost. For more accuracy, they can add reopen rate, reassignment rate, and expected impact from the tooling.
You can review the ROI model every quarter. Update your assumptions when ticket volumes change, automations increase, or operational processes are modified.
It varies by baseline efficiency and tool cost, but teams commonly look for:
- Payback within 3–6 months for impactful tooling
- A 12-month ROI above 100% when tools directly reduce handle time or ticket volume
Sharing conservative, expected, and aggressive scenarios keeps the analysis credible.
A simple way to estimate cost per ticket is to multiply average handle time in hours by your hourly labor cost, then add any overhead you want to include. If your time data isn’t exact, use a conservative AHT and adjust it once reporting improves.


 In this page