


 In this page

Ask most businesses how their customer service is performing, and you’ll likely hear a confident “10 out of 10.” But what do the numbers say?
Customer service metrics offers a reality check through revealing how well your team truly listens, responds, and delivers to meet customer expectations.
But not all metrics are created equal. Choosing the right metrics that are aligned with your goals and customer journey is essential.
With the right data, you can shift from reactive support to proactive engagement, turning everyday interactions into lasting connections.
In this blog, we’ll explore what customer service metrics is, the different types and how they can enhance your service offerings.
What are customer service metrics?
Customer service metrics are specific measurements that assess the quality of customer service, the quantity of support issues handled, and the performance of your support team.
Companies measure these customer service metrics to gain valuable insights into:
-
- How well their customer service performance is.
- How efficient their customer interaction is.
- The productivity of their support team.
- Areas where improvements are needed to enhance their overall customer experience.
Businesses can make informed decisions to improve customer service by analyzing these metrics, therefore increasing customer satisfaction and loyalty.
Types of customer service metrics
Customer service metrics are measures based on performance, quality, and quantity of customer service. Here are some of these metrics:
Quality-related customer support metrics
The following customer service metrics measure how your customer service is impacting your customers:
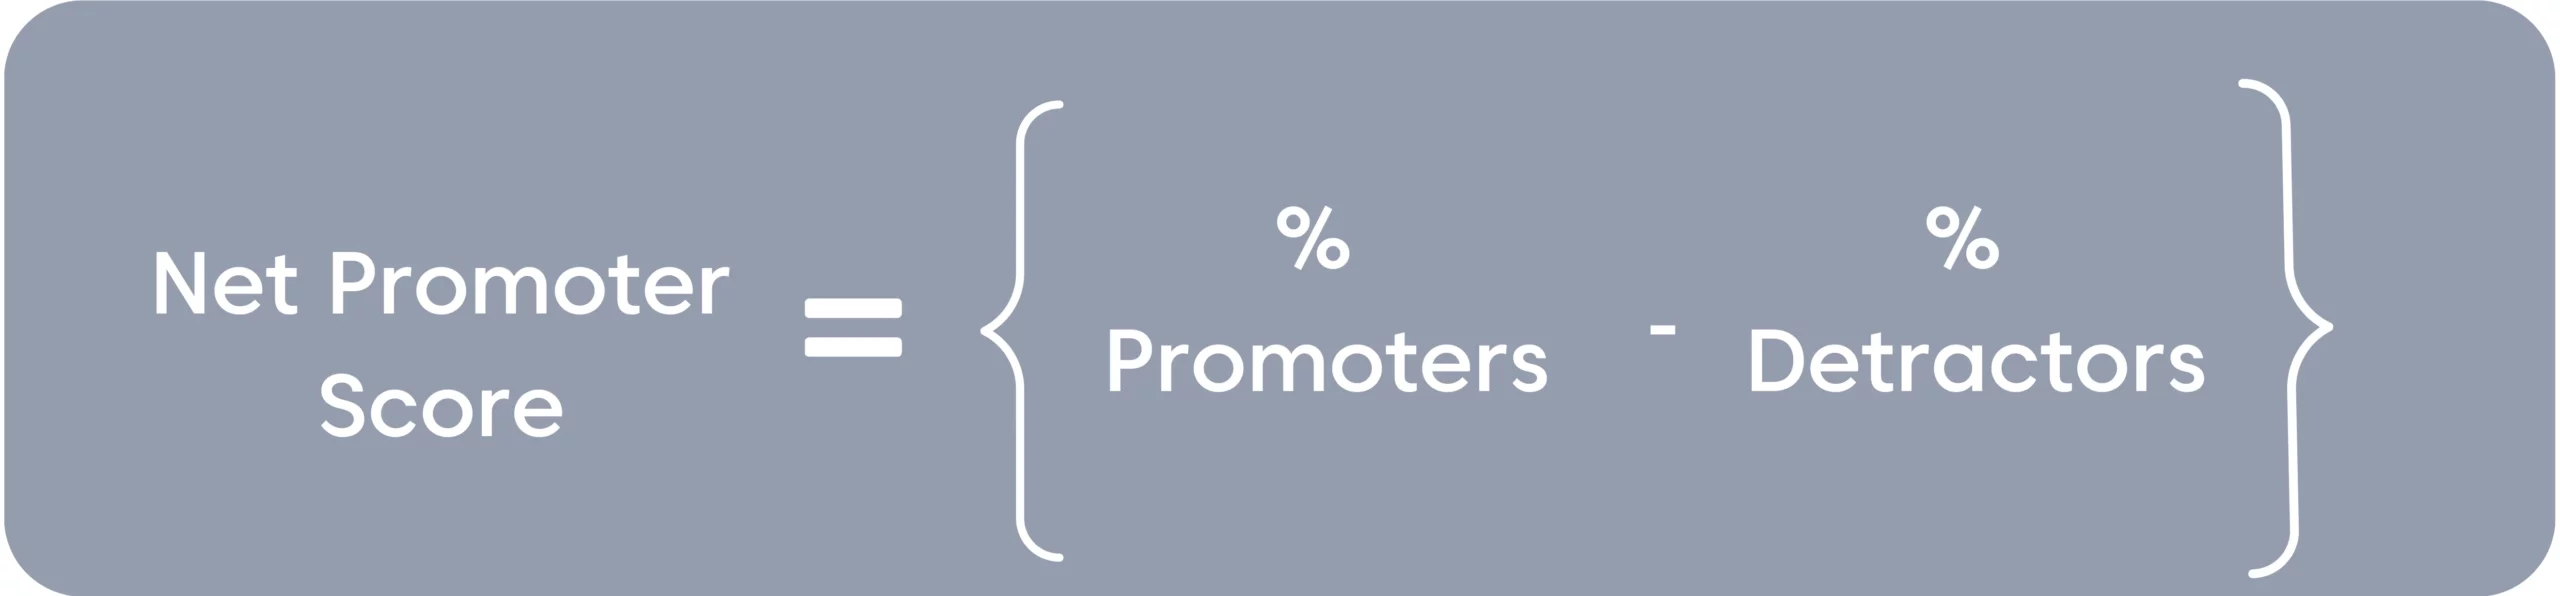
Net promoter score
The net promoter score (NPS) evaluates the probability of consumers recommending a business’s brand to their friends, family, and others.
This assessment is based on a single question, asking if respondents would be inclined to suggest the business to others.
Here is a basic formula you can use:
And if you want to save time while minimizing the chance of manual errors, consider utilizing tools like BoldDesk’s Free NPS Calculator.
It allows you to calculate your Net Promoter Score swiftly and accurately, giving you more time to focus on what really matters—delivering exceptional experiences to your customers!
How to use it:
On a rating range of 0 to 10, respondents indicate their tendency to recommend their brand to others.
They are then categorized as:
- Promoters (9–10)
- Passives (7-8)
- Detractors (0–6)
The net promoter score (NPS) is a complete indicator of consumer advocacy that is calculated by subtracting the number of Detractors from the percentage of Promoters.
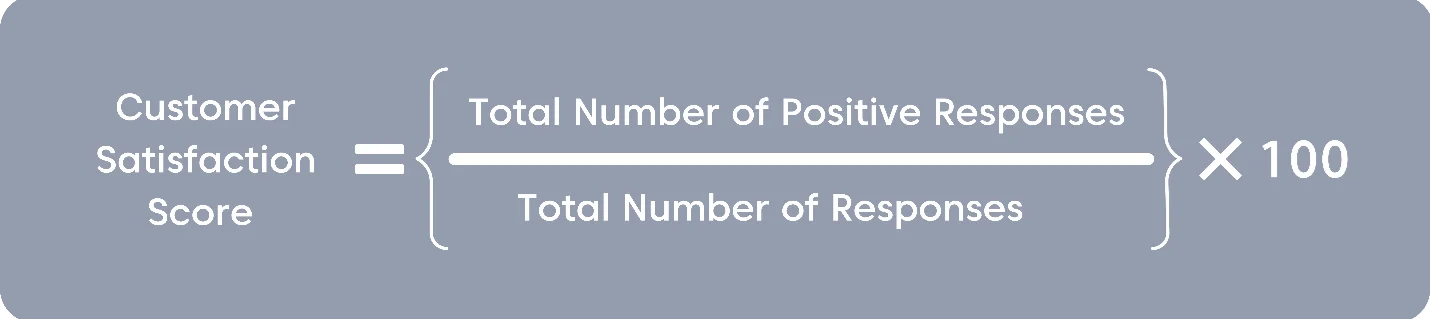
Customer satisfaction score
Customer satisfaction score (CSAT) is a measurement used to evaluate the level of contentment customers experience during a specific interaction or the entire experience with the product or service.
Below is a formula you can use to manually calculate CSAT score:
Alternatively, to optimize CSAT calculation process, customer service teams can make use of BoldDesk’s CSAT score calculator for instant and accurate results.
How to use it:
The customer satisfaction score can always be evaluated through a survey question that includes a scale, such as 1 to 5, that asks customers to rate their level of satisfaction.
The resulting average score is an indication of the overall level of satisfaction.
Customer effort score
The customer effort score (CES) is a metric used to gauge the ease with which customers can accomplish a task using a product or resolve an issue related to your brand.
This measure is obtained by asking customers for feedback on their effort during a specific interaction, usually on a quantifiable scale.
Here is a formula you can use:

How to use it:
Businesses can assess how simple it is for customers to fix problems or issues using customer effort score.
A lower CES suggests that customers felt less effort was required, indicating better user-friendliness.
A higher CES indicates that customers felt more effort was required during their interactions, suggesting the product was hard to use.
Customer retention and loyalty metrics
These types of customer service metrics show how your support offerings affect long-term customer relationships.
Customer retention rate
The customer retention rate is a metric that measures the percentage of customers a business can retain over a specific period.
According to Forbes Advisor, top-performing companies across industries average a customer retention rate (CRR) of 94%.
Therefore, companies should strive to retain customers by offering good customer service.
Here is a formula you can use to calculate customer retention rate:

How to use it:
The customer retention rate helps companies know how many customers are stopping their use of the company’s products or services, possibly due to dissatisfaction, competition, or unmet expectations.
A higher retention rate indicates higher customer satisfaction and implies a greater likelihood of customers continuing with a company’s products or services and remaining loyal.
Low retention rates indicate a decrease in customer loyalty and satisfaction.
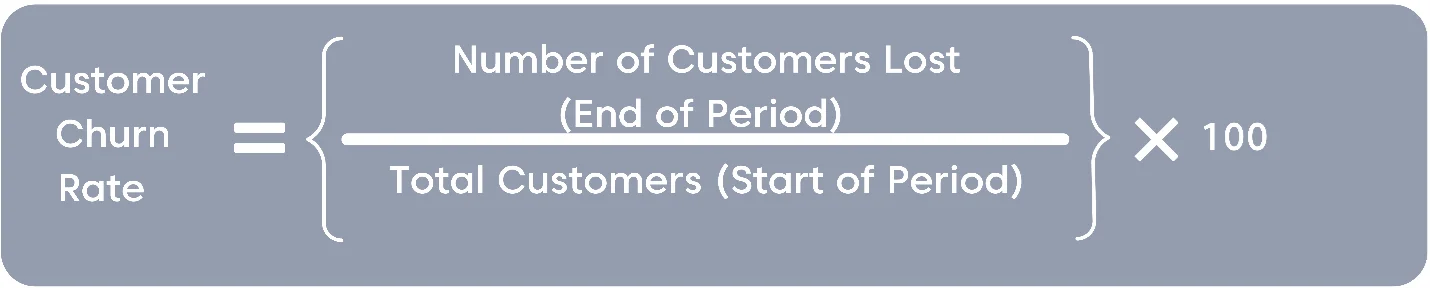
Customer churn
The customer churn rate measures the percentage of customers that stop using a brand or stop doing business with a company within a given period.
This metric, which contrasts with the client retention rate, is crucial to comprehending customer attrition.
Here is an example of a formula you can use:
How to use it:
Customer churn rate determines the proportion of lost business during a given time frame.
By monitoring this rate, companies can identify strategies to retain more customers and improve their services since a higher churn rate indicates customer dissatisfaction.
Customer lifetime value
Customer lifetime value (CLV) is a customer service metric that quantifies the overall value a customer brings to a business throughout their entire association.
Here is a formula you can use to calculate CLV:

How to use it:
CLV is an essential metric that aids businesses in comprehending the significance of customers and determining the appropriate allocation of resources for serving and retaining them.
A high CLV signifies that you have many loyal customers who make frequent purchases and are likely to recommend your business to others.
These customers need exceptional customer service, as their retention can substantially enhance profitability.
Conversely, a low CLV may indicate the need to reassess the customer service approach for that segment. They may be dissatisfied, or there may be untapped opportunities for upselling or cross-selling.
Frequency of upsells and cross-sells
The frequency of upsells and cross-sells is a vital customer service metric that measures how often additional products or services are suggested and sold to customers.
Successful upselling and cross-selling indicate skilled customer service, which improves the customer experience.
This metric also reflects customer engagement, satisfaction, and trust in recommendations.
How to use it:
The frequency of upsells and cross-sells indicates the frequency at which clients upgrade their services or make additional purchases.
It also assesses the effectiveness of sales strategies, enhances sale value, and maximizes revenue.
Additionally, it allows companies to refine their strategies, identify opportunities for improvement, and customize their approach based on customer preferences.
Quantity-related metrics
The following quantity-related metrics measure how productive your customer service is and the amount of work being done:
First contact resolution rate
First contact resolution (FCR) measures support agents successfully resolving issues during their first contact or interaction with customers.
A greater rate signifies effectiveness, enhances customer contentment, and diminishes the need for customers to reach out multiple times concerning the same issue.
This can be done with well-designed service level agreements (SLAs), which help the support team monitor each customer ticket.
How to use it:
By watching the FCR rate, you can learn how effective your customer service is and monitor your support agents’ ability to resolve customer issues during the first interaction.
Average resolution time
Average resolution time (ART) is a critical metric measuring a support agent’s average duration to resolve customer concerns. It encompasses when a customer first raises an issue until it is completely resolved.
Several factors can influence ART:
- The complexity of problems
- The expertise of the support team
- The available tools and resources for problem-solving
Here is a formula you can use:
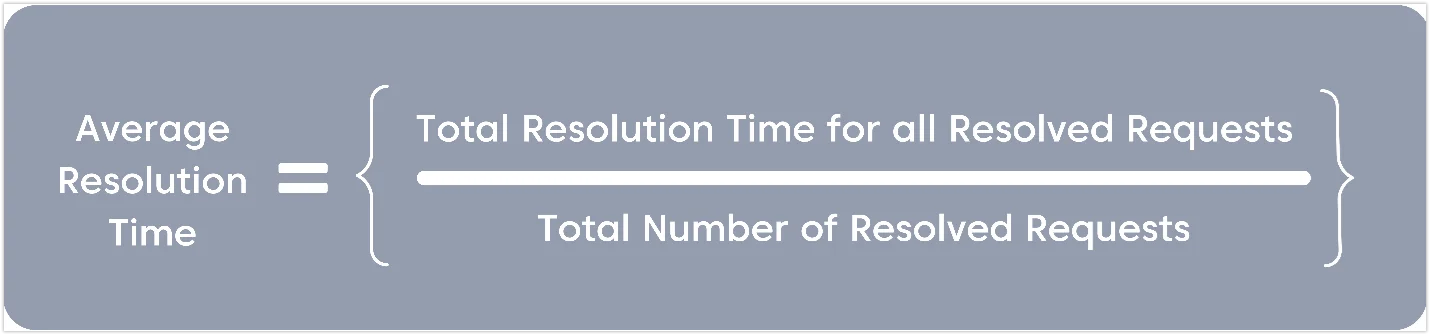
How to use it:
This metric is essential for evaluating the effectiveness and efficiency of a customer support team.
A lower ART indicates a quicker response and resolution procedure, potentially increasing customer satisfaction.
Conversely, a high ART may indicate inefficiencies in the resolution process, which could result in customer dissatisfaction.
Performance-related customer support metrics
These customer service metrics are used to measure how long support agents take to resolve customer issues:
Ticket volume
Ticket volume is the total number of customers’ support tickets or questions received within a given time frame.
Here is a formula you can use to measure ticket volume:
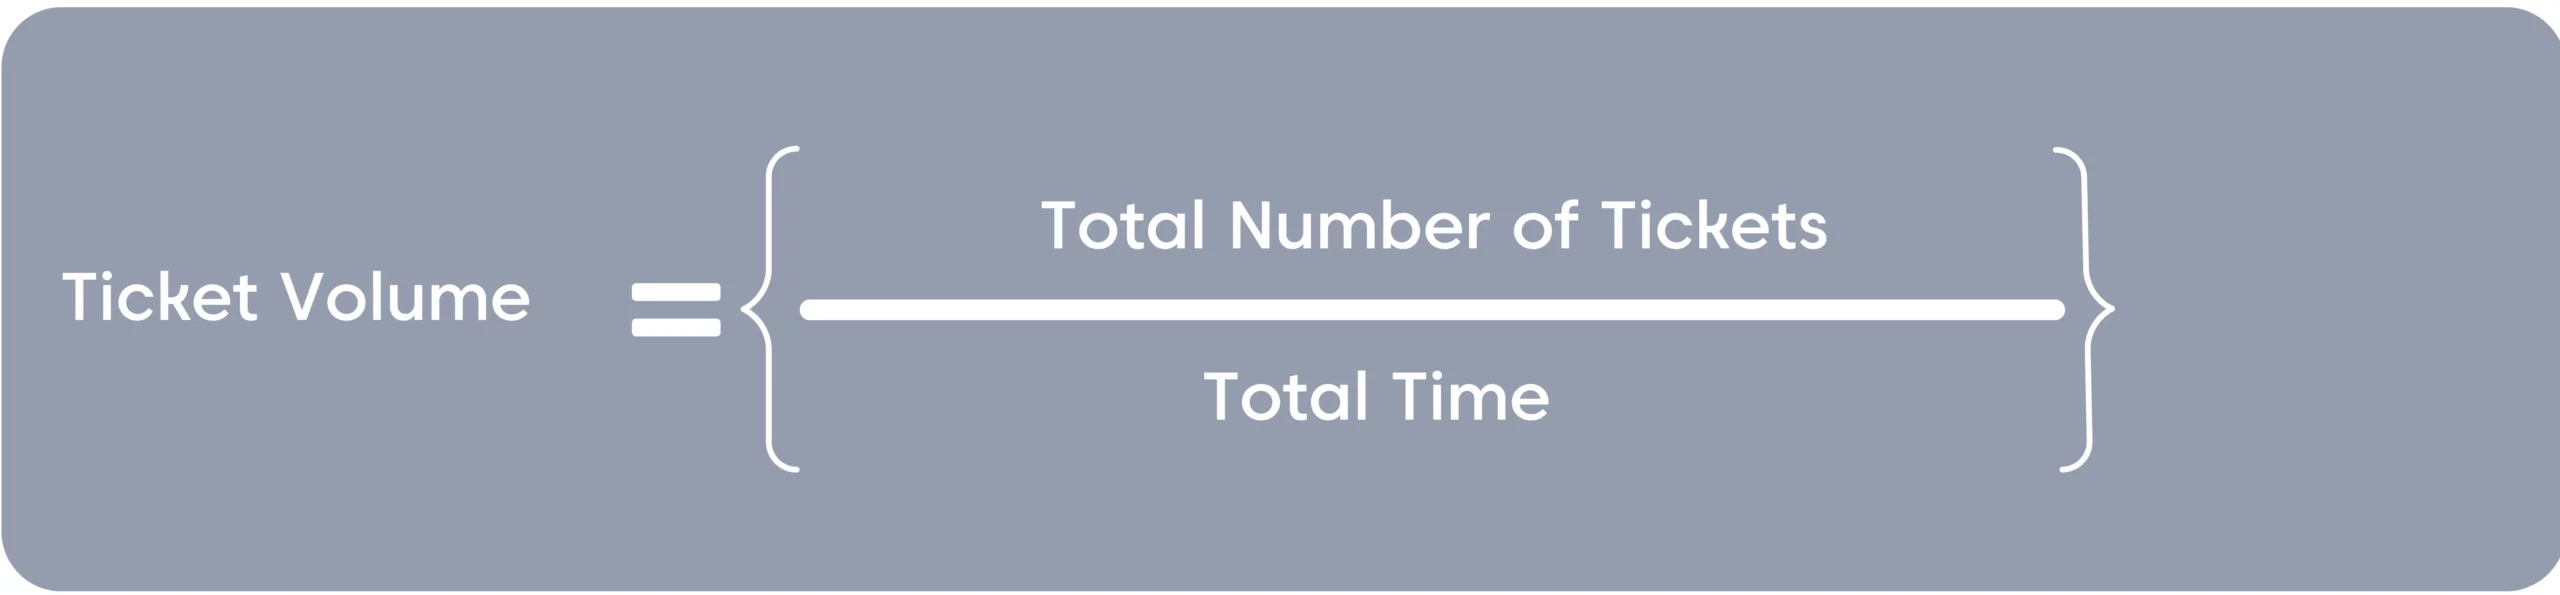
How to use it:
The goal of monitoring and analyzing ticket volume is to assess the volume of work performed by the customer support team and to provide information about common trends and patterns regarding client complaints.
Tickets resolved
The “tickets resolved” metric indicates the total number of tickets the customer support team resolved.
It shows the volume of successfully resolved customer issues.
How to use it:
This metric is important, as it indicates the effectiveness and efficiency of your support team in successfully addressing customer issues or inquiries.
It can also assist in identifying recurring issues, allowing for proactive measures to prevent them.
A high number of resolved tickets demonstrates a responsive and efficient support team.
On the other hand, a low number may indicate inefficiencies or obstacles in solving customers’ issues or inquiries.
Number of unresolved tickets
The number of unresolved tickets measures the total number of customer problems or unresolved requests within a specific timeframe.
This measure is vital because it directly affects customer satisfaction and loyalty. A high number of unresolved tickets indicates inefficiency in addressing customer issues, meaning bad customer service.
It is essential for companies to monitor this measure and strive to keep it as low as possible.
How to use it:
By analyzing these tickets, companies can recognize opportunities for development and take the initiative to improve offerings.
Additionally, reducing the number of unresolved tickets can enhance operational efficiency. Companies should keep track of open tickets to know how many are not resolved.
First response time
First response time (FRT) is a support agent’s time to respond to a customer’s initial inquiry. It is a crucial metric that assesses the effectiveness of a customer support team.
To optimize the first response time measure, it is imperative for businesses to consistently monitor and assess the duration it takes to acknowledge and address consumer inquiries through various communication channels such as email, social media, and others.
Here is a formula you can use:
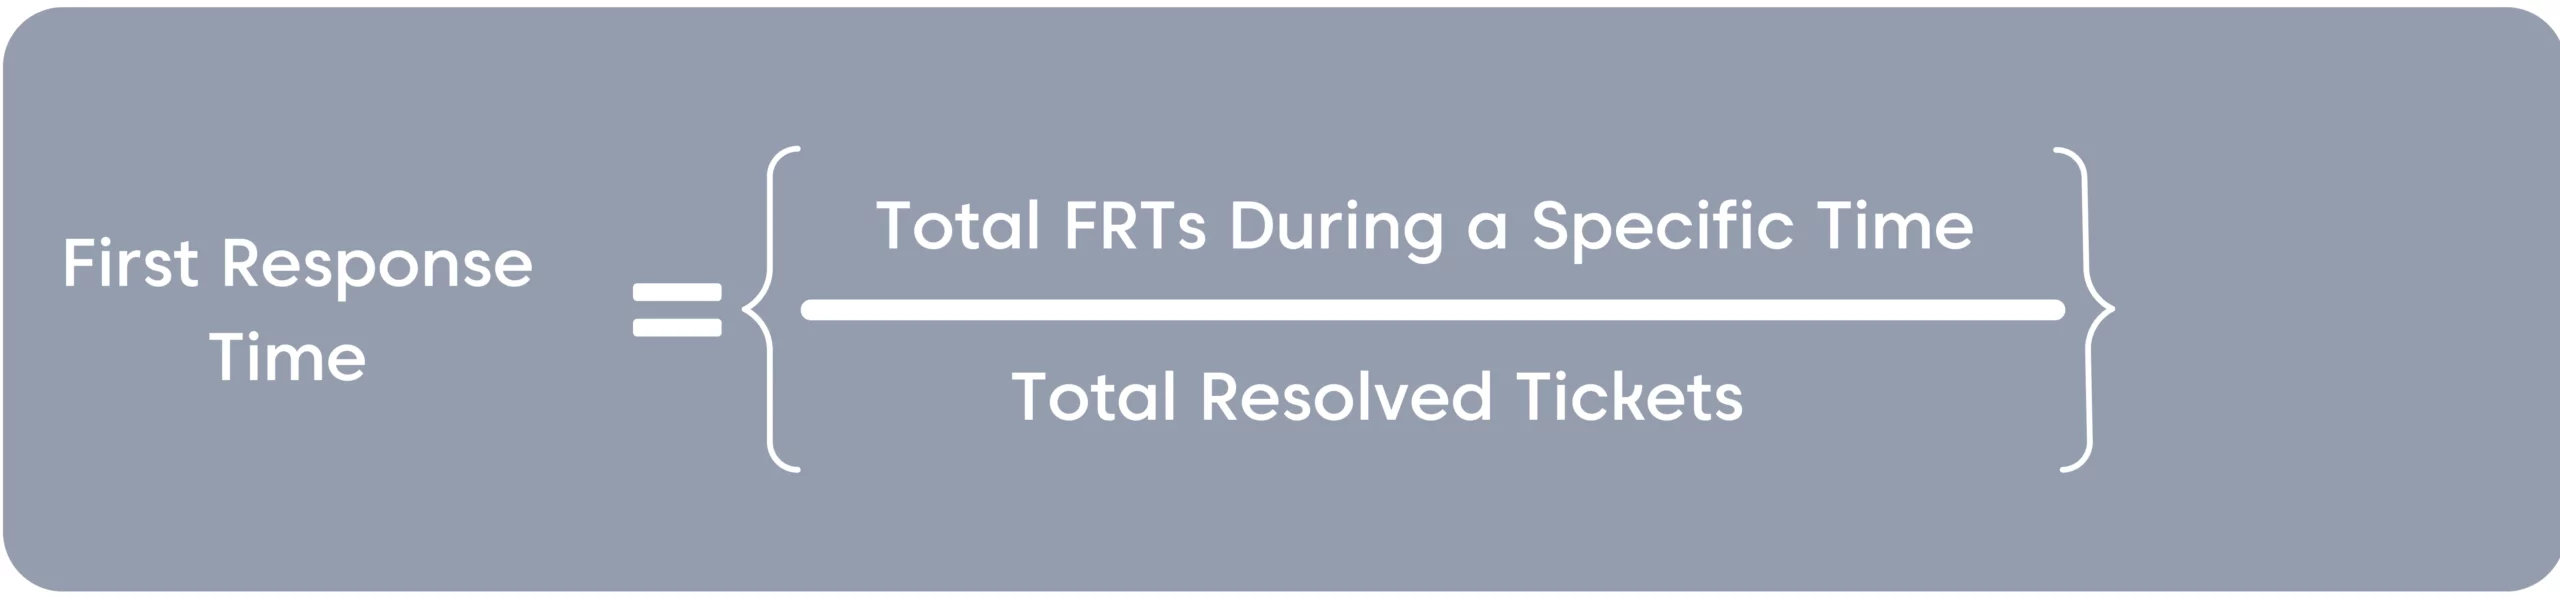
How to use it:
By measuring FRT, you can assess the following:
- The level of priority you assign to client concern
- How well your team is providing customer support
- How well the support system is managed
A prompt response demonstrates a commitment to customer satisfaction, a positive impact on customer perception, and loyalty in customer service.
Average ticket handling time
Average ticket handling time is a key measure in customer service for gauging how long it takes to address a customer’s issue or resolve a ticket. Shorter times indicate efficient service, but balancing speed with quality is tantamount.
Rushing solutions for the sake of speed can lead to customer dissatisfaction.
Here is a formula you can use to calculate AHT:
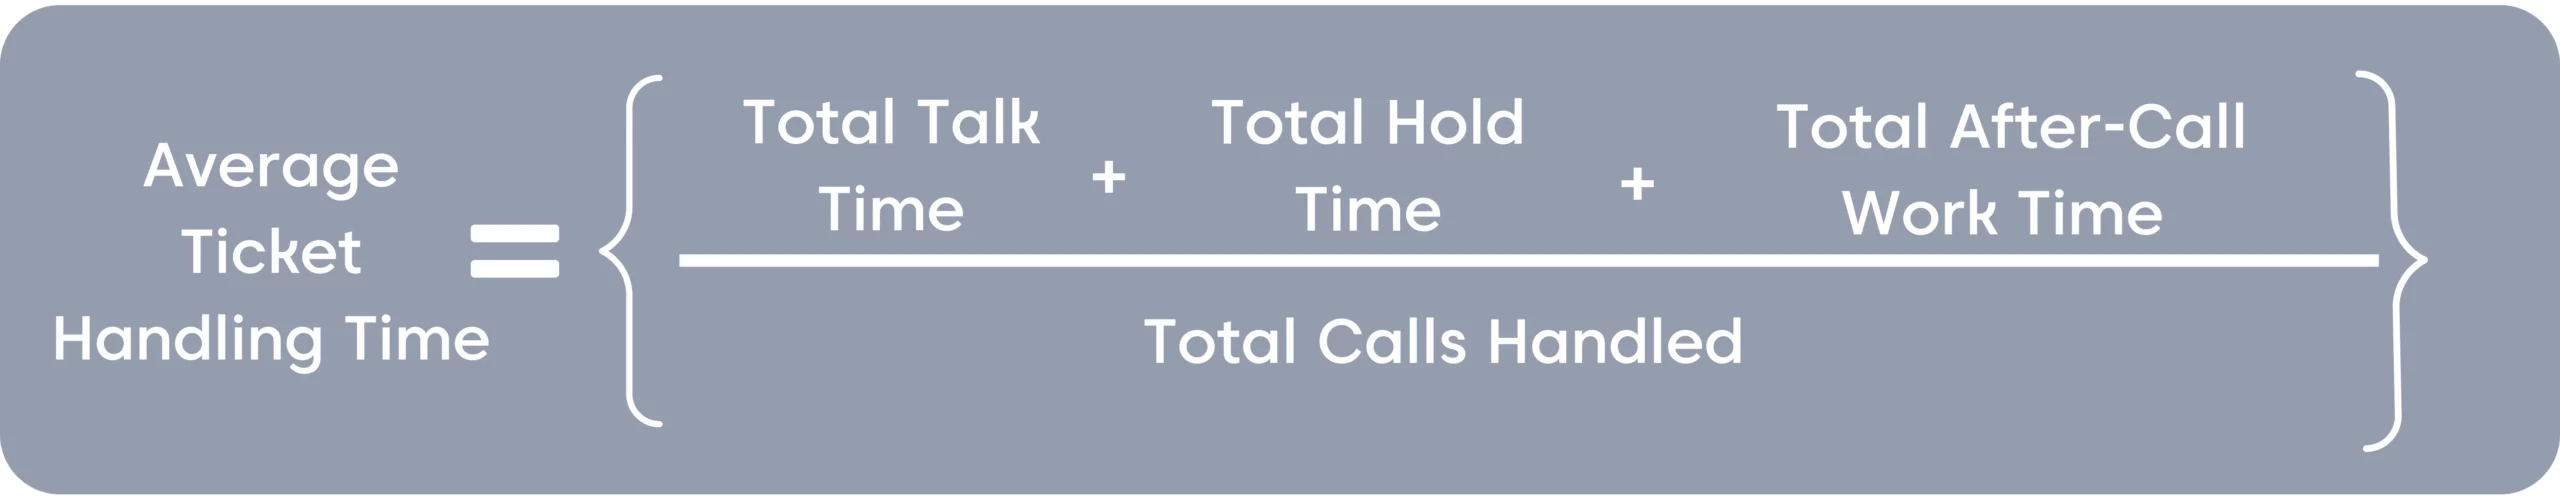
How to use it:
Analyzing trends in handling time can provide insights into support processes and workforce efficiency.
Variations may signal a need for training or improved procedures.
Ultimately, a well-managed balance ensures prompt, high-quality assistance for customer satisfaction and loyalty.
Social media metrics
Social media metrics gauge how successful your customer support agents are at meeting your customer needs.
These metrics show what your social customer service team is doing well, where they can improve, and what resources they need to close those gaps.
You can measure social media through the following metrics:
- Number of followers
- Likes
- Shares
- Comments
- Mentions
These metrics provide valuable insights into a company’s performance, customer perception, brand awareness, and sentiment.
How to use it:
This metric assesses how well your social media presence reflects your brand, how involved you are with your customers, and how you can enhance your entire online presence.
By tracking these metrics over time, you can make data-driven decisions to improve customer service and satisfaction
Importance of metrics for customer service
Customer service metrics track key aspects of support interactions to provide a clear picture of how the service is being delivered.
Here are some of the benefits of customer service metrics:
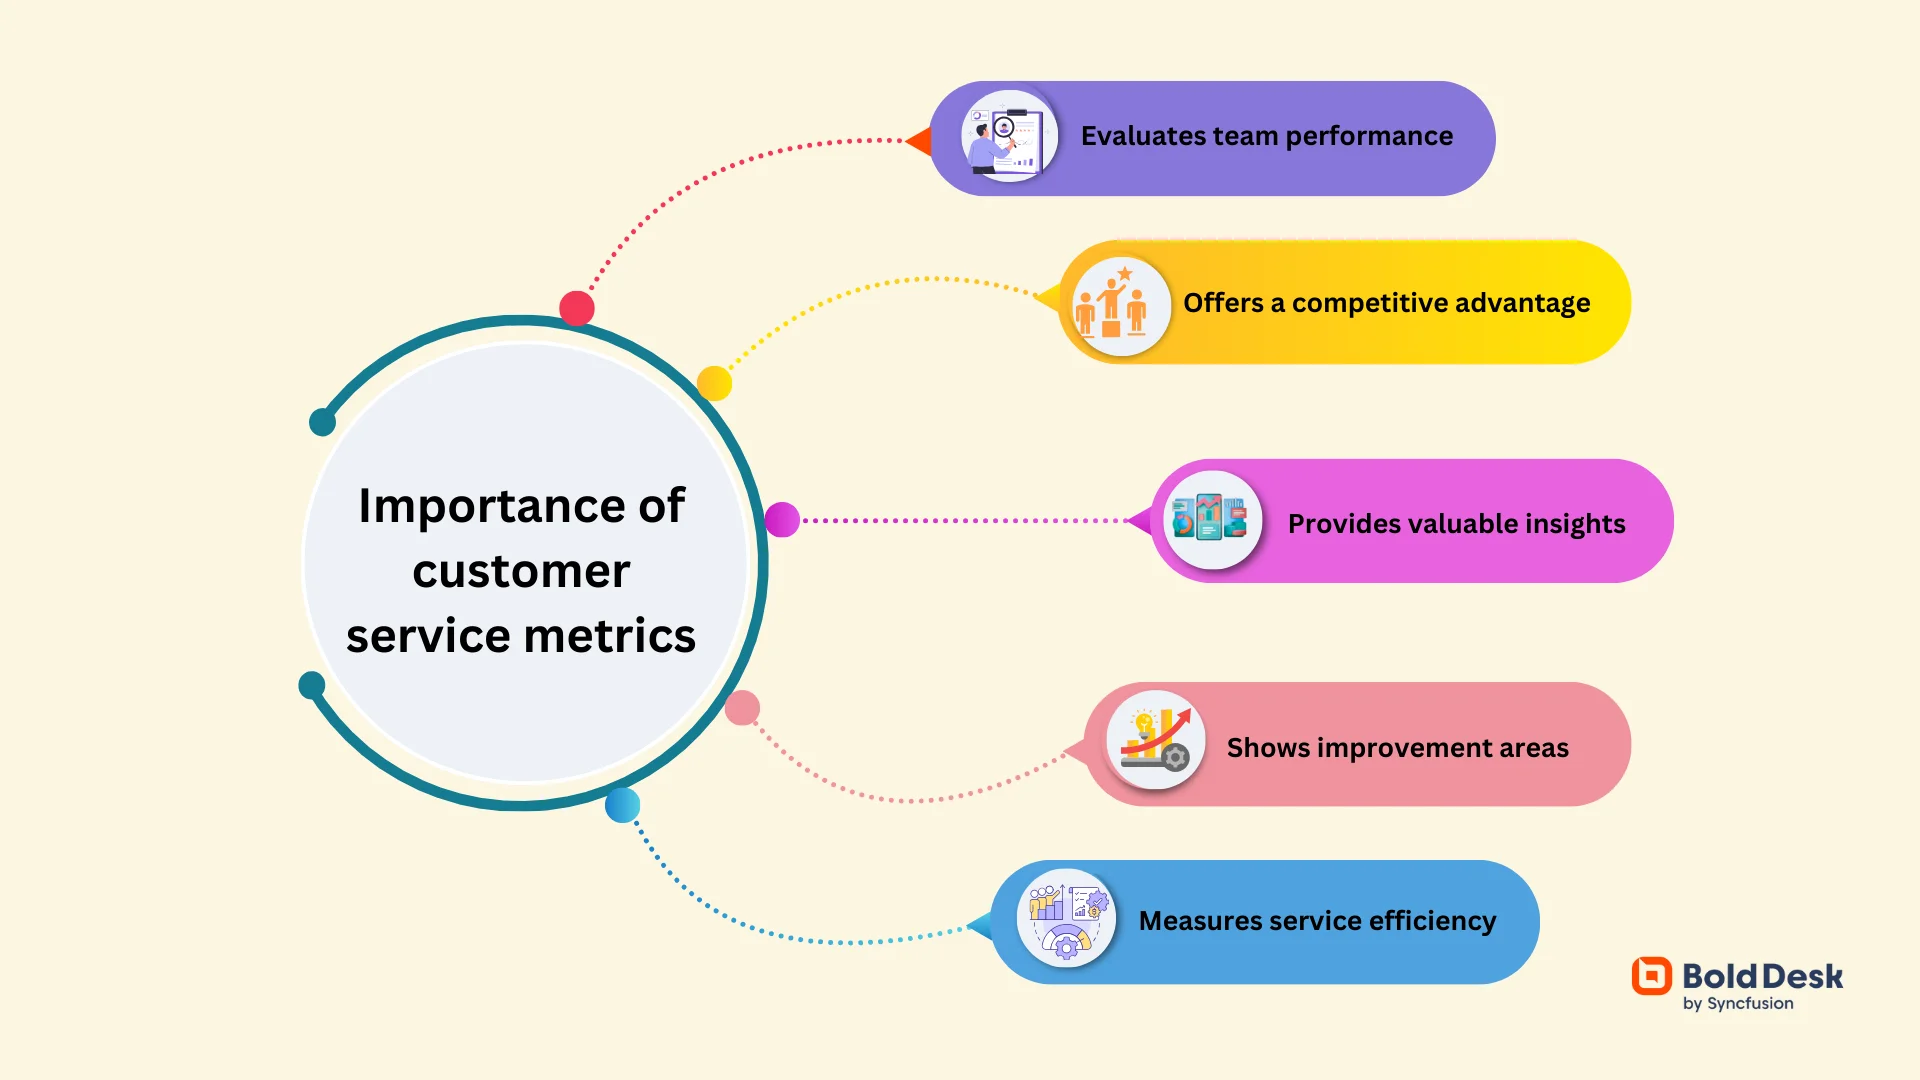
- Evaluates support team performance – Customer service metrics helps identify top performers, training needs and areas of improvements to build a more effective support team.
- Creates a competitive advantage – With these insights, brands can highlight what sets them apart and tailor their offerings to outdo competitors in meeting customer needs.
- Provides valuable insights for decision-making – Delivers clear, factual information about customer needs and service performance to guide smarter business choices.
- Helps identify areas for improvement – Reveals inefficiencies and bottlenecks in support workflows to guide targeted process enhancements.
- Measures service efficiency – Tracking metrics like response time and resolution rate ensures timely, high-quality support.
How to select the right customer service metrics for your organization
Great customer service starts with measuring what truly matters, but choosing the right metrics can make or break your strategy. Below are the steps to help you choose customer service metrics wisely.
Align metrics with business objectives
To choose the right customer service metrics, start by aligning them with your core business goals, such as improving customer retention, or increasing satisfaction.
For instance, if your goal is to reduce support costs and improve efficiency, focus on metrics like First Contact Resolution (FCR) and Average Handling Time (AHT).
Prioritize actionable metrics
Select metrics that provide clear insights and can drive specific improvements, rather than those that simply look good on paper.
Metrics like Abandonment Rate reveal where customers are dropping out of the support process which helps customer service teams to streamline workflows, reduce friction, and improve overall experience quality.
Balance quantitative and qualitative insights
Combine numerical data like response time and CSAT scores with qualitative feedback from customer comments, surveys, and support interactions.
This dual approach reveals not just what is happening, but why, such as a low CSAT score tied to a specific service pain point.
Map the customer journey
Identify key touchpoints across the customer journey, from initial inquiry to post-resolution follow-up, to determine which metrics matter most at each stage.
For examples, quick response time is critical during initial contact, while Customer Effort Score (CES) matters more after issue resolution.
Limit the number of metrics
Focus on 5–7 essential metrics to maintain clarity and prevent overwhelming your support team.
Using fewer and tailored metrics ensures accountability and keeps attention on what truly impacts customer experience.
Benchmark against industry standards
Compare your customer service metrics to industry averages to gauge performance and set realistic goals. Benchmarking helps identify gaps and opportunities for improvement.
Leverage technology for tracking
Customer service platforms help automate the tracking, analysis, and reporting of key metrics across all support channels.
With real-time dashboards and built-in analytics, customer support teams can focus on improving service rather than manually collecting data.
Leverage customer service metrics to improve support quality
Customer service metrics are crucial for assessing and improving customer experience and support operations.
They offer data to evaluate support agent performance, identify areas for growth, and make informed decisions.
Remember, a successful business prioritizes customers and constantly seeks to improve.
Leverage BoldDesk’s built-in CSAT surveys and agent performance dashboards to track key customer service metrics and drive continuous improvement.
Sign up for a free trial or book a live demo to see the advantages BoldDesk can provide to your support team. Contact support with any questions you may have.
We hope this post was insightful. Do you have any additional comments? Leave your feedback in the section below!
Related articles
- 11 Key Help Desk Metrics to Track Team Performance
- 7 Best Techniques for Reducing Customer Service Response Time
- 10 Important Customer Service KPIs to Track
Frequently Asked Questions
A measurable customer service KPI (Key Performance Indicator) is a specific metric used to assess the effectiveness and efficiency of your support team. Examples include First Response Time, Ticket Resolution Time, and Customer Satisfaction Score (CSAT).
These KPIs help you track performance, identify areas for improvement, and ensure consistent service quality.
Customer Satisfaction Score (CSAT) is widely regarded as one of the best KPIs for measuring customer satisfaction.
It collects direct feedback from customers immediately after their support interactions, offering clear insights into how well your service met their expectations.
Customer service metrics should be tracked in real time or at consistent intervals such as daily, weekly, or monthly depending on the specific metric.
Real-time tracking is essential for time-sensitive KPIs like First Response Time, while broader indicators such as Customer Satisfaction (CSAT) are best reviewed weekly or monthly to identify trends and improve long-term service quality.
Key metrics for improving customer support include:
- First Response Time: Measures how quickly agents respond to new tickets
- First Contact Resolution: Tracks whether customer issues are resolved in the first interaction
- CSAT and Net Promoter Score (NPS): Reflect customer satisfaction and loyalty
These KPIs help identify what’s working and where enhancements are needed.


