


 In this page

You know the feeling when a customer keeps coming back, tells their people about you, and even defends your brand online like it’s their favorite football team?
Such loyalty is not just about repeat purchases or likes on social media, but proves how likely someone is to recommend you without hesitation, being asked, or offered incentives.
But here’s the million-dollar question: How do you measure that kind of devotion?
To solve this, Fred Reichheld (partner at Bain & Company) introduced Net Promoter Score in his landmark Harvard Business Review article, The One Number You Need to Grow. This translates customer sentiment into a single, easy-to-understand score.
In this article, we’ll look into net promoter score, how to calculate, and how you can use it to drive business growth and success.
What is a net promoter score (NPS)?
The Net Promoter Score® is a customer loyalty metric that measures the likelihood of customers recommending your company, product, or service to others.
It offers a quick snapshot of customer loyalty and satisfaction, helping you identify unhappy customers and turn them into loyal advocates.
NPS scores range from –100 to +100, with higher scores indicating that your business consistently delivers value, is trustworthy, and meets customer expectations.
When tracked consistently, net promoter score becomes a strategic tool for leveraging customer sentiment to enhance experiences, deepen loyalty, and drive sustainable business growth.
How to calculate net promoter score
This guide explains how to calculate NPS clearly and concisely, with a step-by-step process to make NPS calculation easy to follow.
Ask the NPS question
Calculating your net promoter score is simple and straightforward. It all starts by asking your customers one simple net promoter score question.
This question could be in the form of:
“On a scale of 0 to 10, how likely are you to recommend [Company/Product] to a friend, family member, or colleague?”
To make this even easier, most businesses use ready-made NPS survey templates. These templates help you collect responses consistently, analyze results quickly, and take action based on honest customer feedback.
Categorize the NPS survey responses
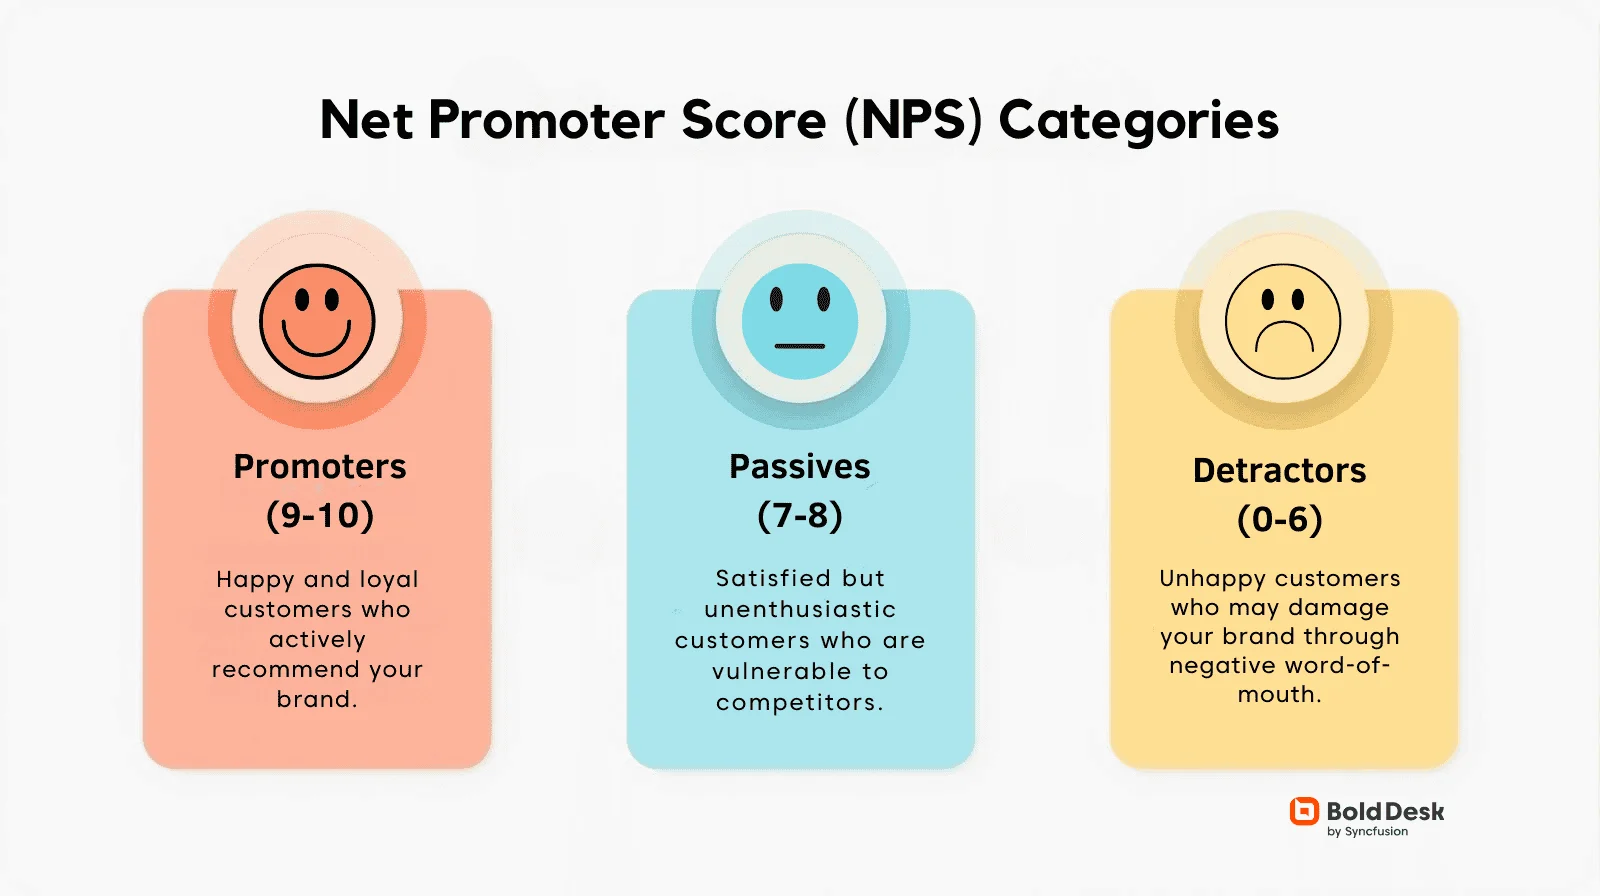
Based on the provided NPS survey responses, customers are then grouped into three categories as follows:
- Promoters (9–10): These are your loyal fans. They actively recommend your business and help drive growth through positive word-of-mouth.
- Passives (7–8): They’re satisfied but not enthusiastic. They won’t hurt your brand, but they’re also not helping it grow, and they could easily switch to a competitor.
- Detractors (0–6): These are unhappy customers. They’re likely to share negative experiences and can damage your reputation.
Pro-Tip: The real value of NPS comes from the follow-up question: “What’s the main reason for your score?” This provides actionable insights beyond the number.
Calculate your NPS score
To perform the NPS calculation, you can use either of the two methods provided below:
Manual calculation through the NPS formula
Calculate your NPS by subtracting the percentage of detractors from the percentage of promoters, as indicated in the formula below.

Where;
% Promoters = (Number of Promoters ÷ Total Responses) × 100
% Detractors = (Number of Detractors ÷ Total Responses) × 100
NPS calculation example
Let’s say you conduct an NPS survey and 100 customers respond. Out of the total responses, 60 customers are promoters (score 9–10), 20 are passives (score 7–8), and 20 are detractors (score 0–6).
Calculate the percentages for promoters and detractors as indicated below:
- % Promoters = (60 ÷ 100) × 100 = 60%
- % Detractors = (20 ÷ 100) × 100 = 20%
To get your score, subtract % Detractors from % Promoters as shown below:
NPS = 60% − 20% = 40
Pro tip: Passives are not included in the net promoter score calculation.
Automate your NPS calculation with BoldDesk’s free tool
For a faster and more efficient way to calculate your NPS, try the free BoldDesk NPS calculator. This automation tool allows you to simply enter your response data and instantly generate your NPS score, no manual calculations required.
What is a good net promoter score?
NPS scores range from -100 to +100, reflecting the balance between promoters (loyal customers) and detractors (unhappy customers).
A score above 0 is generally positive, as it indicates more customers are likely to recommend your business than criticize it. However, what qualifies as a “good” NPS varies by industry and customer expectations.
For example, a score of 30 might be excellent for a bank but average compared to a software company, where customer expectations and benchmarks are higher.
To gauge your performance, compare it to industry averages. This will help you understand how your customer loyalty compares to competitors’ and sector benchmarks.
How to interpret your net promoter score
NPS is a powerful customer experience metric for gauging customer loyalty, but its interpretation depends heavily on industry norms, customer expectations, and business models. Here’s a quick guide to make your NPS interpretation easier.
| NPS score | Interpretation |
| Above 0 | It means you have more promoters than detractors. |
| +30 to +40 | A solid performance with room for improvement, indicating a solid base of loyal customers. |
| Above +50 | Considered world-class. Companies achieving this often have highly reliable and quality products, exceptional customer support, and robust communities. |
| Below 0 | Indicates more detractors than promoters, signaling major problems with product, service, or experience. |
| -10 to -50 | A major red flag showing widespread unhappiness and high churn risk, threatening revenue and growth. |
| -100 | All respondents are detractors. This is an extreme case requiring urgent, transformative action. |
Pro tip: Any score below zero (0) is considered a bad net promoter score. This means your business has more detractors than promoters, indicating that a significant portion of your customers are unhappy and unlikely to recommend your brand.
NPS benchmarks by industry
According to SurveyMonkey benchmark data of over 150,000 organizations:
- The average NPS across all industries is +32
- The top 25% of companies score +72 or higher
This means if your NPS is above +32, you’re doing better than most. Also, if you’re hitting +72 or more, you’re among the best performers.
This overview presents the average Net Promoter Score (NPS) ranges by industry in 2025, based on data from trusted sources like Retently, SurveyMonkey, and Qualtrics XM.
| Industry | Average NPS Range | Top Performers |
| B2B Software & SaaS | 36–41 | Zoom, NetMotion |
| Hotel & Hospitality | 44–70 | Hyatt, Marriott |
| Retail & Grocery | 40–70 | Kroger, Publix |
| Automotive | 30–50 | Toyota, Tesla |
| Banking & Financial | 25–45 | USA, Navy Federal |
| Healthcare & Telemedicine | 30–55 | Independent Clinics |
| Technology & SaaS | 40–55 | Adobe, Salesforce |
| E-commerce | 35–50 | Amazon |
Ways to collect net promoter score survey responses
Conducting an NPS survey and collecting feedback effectively means meeting your customers where they are and making it easy for them to respond.
Here are some of the most impactful methods to gather feedback across different customer touchpoints:
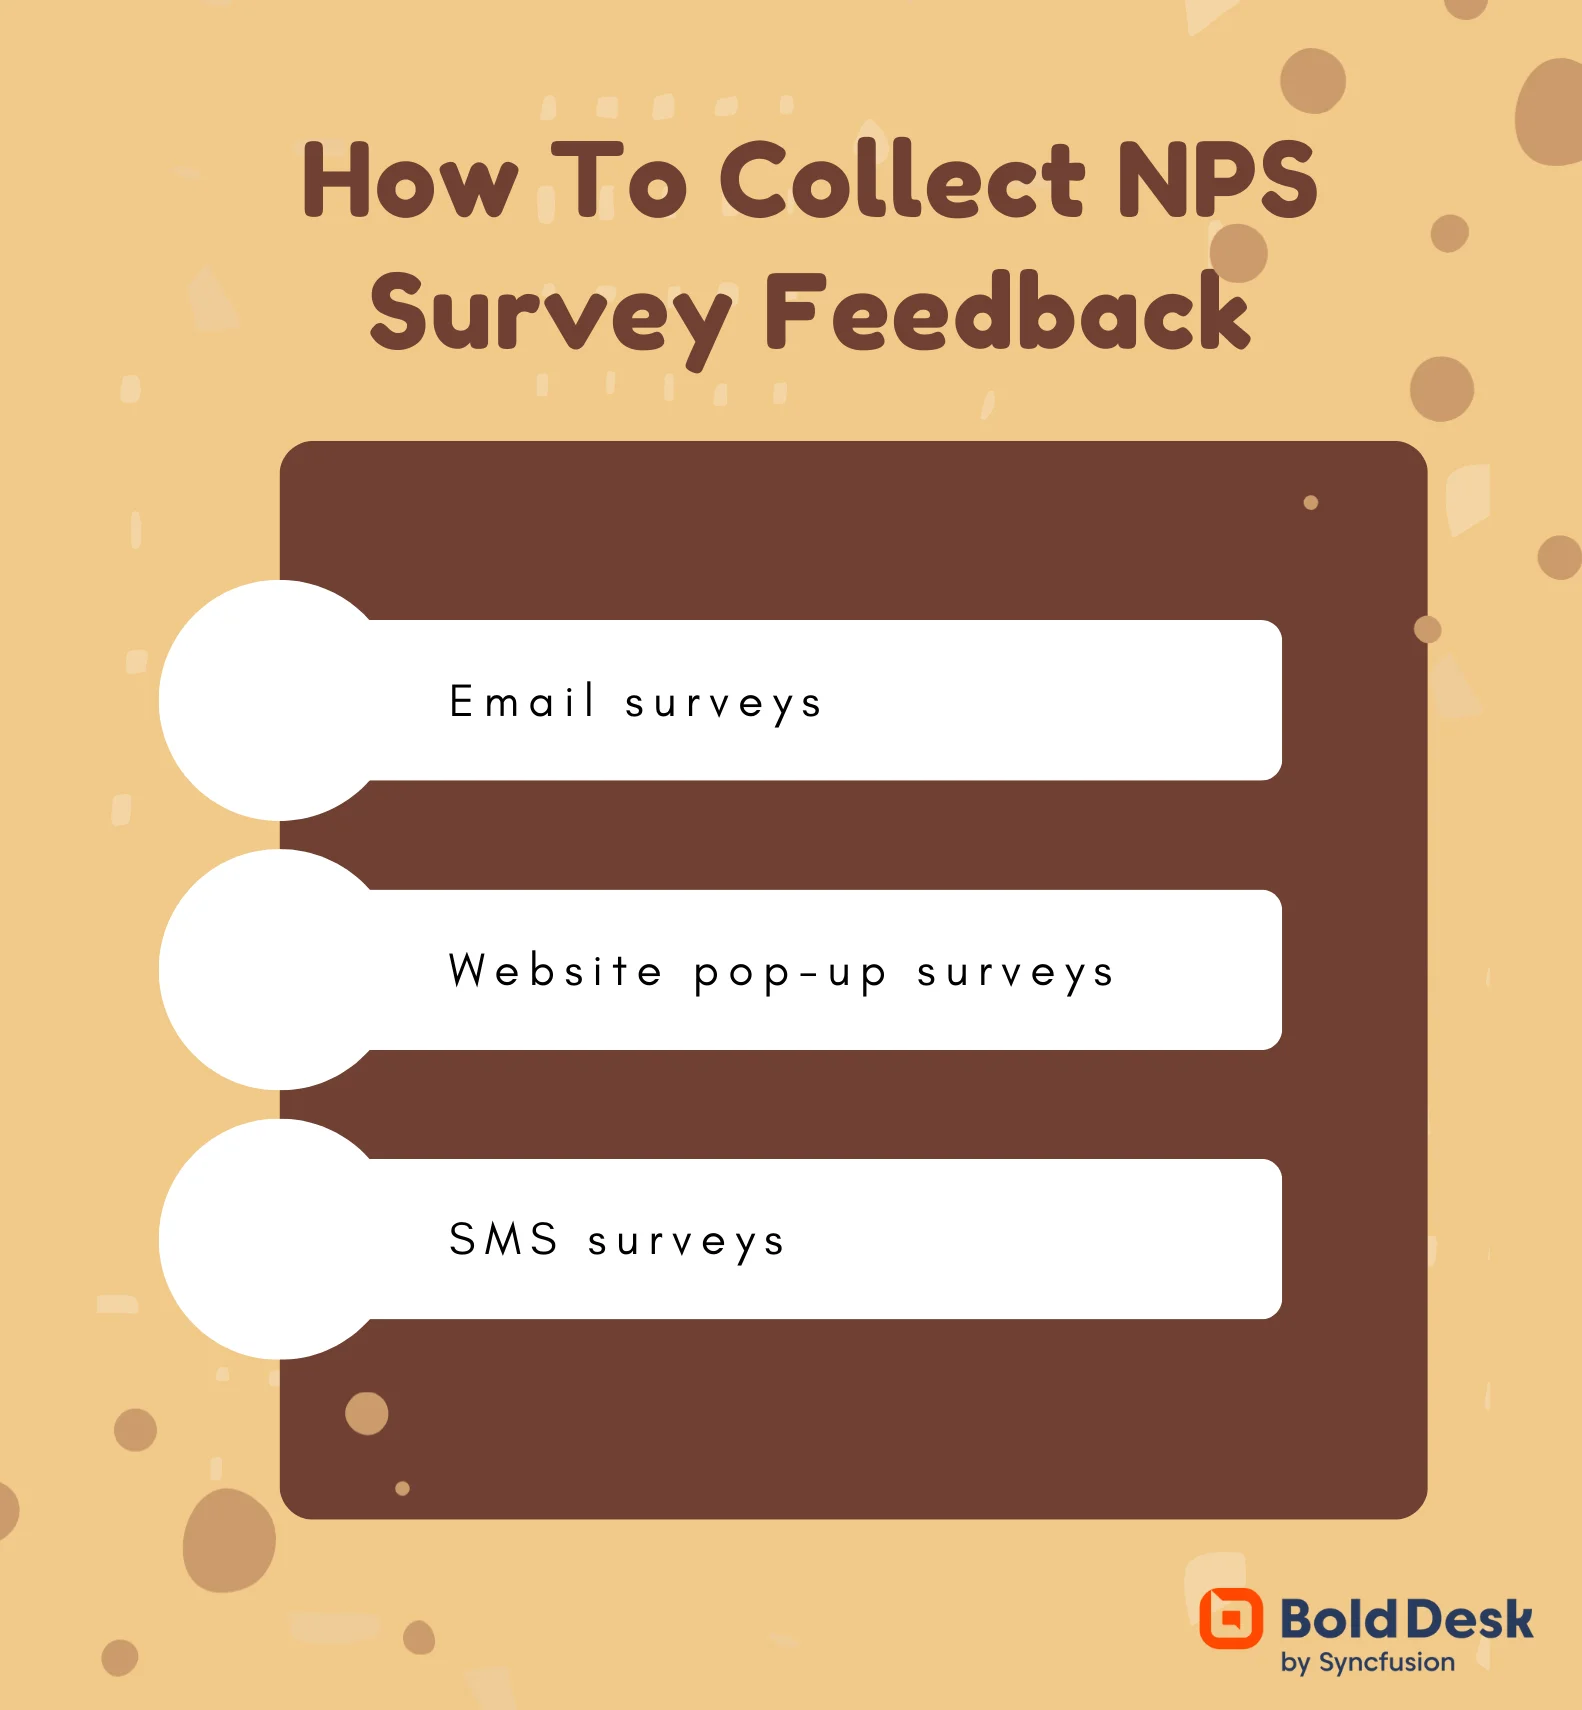
- Email surveys: After a purchase or support interaction, businesses send a quick NPS question directly in an email as an NPS survey tool, making it easy for customers to respond without leaving their inbox.
- Website pop-up surveys: These surveys appear while customers browse, often triggered by actions like spending time on a product page or completing a task. They are great for capturing feedback in the moment.
- SMS surveys: Involves using short and direct text messages to ask the NPS survey question, allowing customers to reply instantly from their phones. They are a perfect feedback collection method for fast, mobile-friendly feedback.
How to improve your NPS score
Successful improvements to the net promoter score require commitment and a multifaceted approach, especially for businesses in high-demand industries.

Set team NPS goals tied to performance
To improve your net promoter score, assign specific NPS targets to each team, such as having product teams reduce friction in usability or support teams resolve issues faster, and tie those goals to performance reviews or KPIs.
By embedding NPS goals into team responsibilities and performance metrics, businesses create a culture of ownership around customer experience, leading to faster improvements that ultimately boost NPS scores.
Prioritize pain points that affect your NPS score
Many companies spend too much time fixing minor issues that have little effect on their net promoter score.
The real impact comes from solving major pain points, like a confusing customer onboarding process, which frustrates most customers. This easily turns detractors into promoters, thus improving the net promoter score.
Transform NPS data into targeted action plans
Measure your net promoter score consistently (monthly or quarterly), and segment data by customer type, product, or region.
This helps you pinpoint the specific areas driving loyalty and which ones need attention so you can make targeted improvements that directly elevate your net promoter score.
Turn passives to promoters
Spend less energy trying to win over detractors because it’s slow, challenging, and often unpredictable. Start with your passives: those quiet 7s and 8s who are almost happy.
Simple improvements like a well-timed thank-you can quickly turn them into loyal promoters. They’re easier to impress, faster to convert, and can increase your net promoter score with less effort.
Deliver quality customer experience
To consistently improve your net promoter score, focus on delivering experiences that feel effortless and supportive. It could be in the form of intuitive products that don’t require a manual, instant help from tools like AI agents when customers get stuck, and skilled human support when things get complicated.
When customers feel taken care of without fighting for it, they’re far more likely to become loyal promoters who rave about your brand to others, improving your NPS score.
Why is measuring NPS important for customer service teams?
Implementing NPS offers numerous advantages for businesses seeking to improve customer satisfaction and drive growth. Some of the most notable benefits include:
- Boosts results with performance benchmarking: Comparing your NPS score to set goals or industry standards helps you understand how well you’re doing. It reveals strengths, highlights areas for improvement, and supports better decisions to improve team productivity and collaboration.
- Strong indicator of business growth: A high NPS means your customers are likely to recommend your business to others, creating powerful word-of-mouth marketing. This organic promotion builds trust, expands reach, and drives growth, often at little to no cost. In fact, a Havard Business Review study found that companies with the highest NPS in their industries grow revenue up to 2.5 times faster than their competitors, proof that loyalty really does pay off.
- Leads to customer retention: NPS helps businesses retain customers by identifying dissatisfaction early and enabling timely intervention. By tracking feedback from detractors and passives, companies can address customer pain points, improve experiences, and turn at-risk customers into loyal advocates.
- Promotes customer-centric decision making: By grounding business strategies in real customer feedback, NPS shifts the focus from internal assumptions to external realities, ensuring that improvements, innovations, and priorities align with what customers truly value. This leads to more empathetic, responsive, and loyalty-driven outcomes.
Turn net promoter score into measurable business success
Net promoter score remains a powerful, scalable way to understand customer loyalty. When used thoughtfully, it becomes more than a number; it becomes a feedback engine for business growth.
Remember, the best score is not necessarily the highest number, it’s the score that consistently improves through genuine customer experience enhancements.
Start measuring your NPS scores today, benchmark against industry standards, and most importantly, use the insights to create experiences that turn customers into passionate advocates for your brand.
Thankfully, BoldDesk® is a comprehensive customer service software that makes it easier to collect, analyze, and act on net promoter score feedback at scale.
Contact our support team at your convenience for assistance or to learn more about BoldDesk.
Please let us know what you think about this topic in the comments section below.
Related articles
Frequently Asked Questions
Here’s a more practical comparison:
| Metric | What It Measures | Question Asked | Best Used For | Limitations |
| NPS | Loyalty and likelihood to recommend | “How likely are you to recommend us?” | Tracking overall brand sentiment | Doesn’t explain why customers feel that way |
| CSAT | Satisfaction with a specific interaction | “How satisfied were you with your experience?” | Measuring service or product satisfaction | Can be influenced by short-term emotions |
| CES | Ease of customer experience | “How easy was it to resolve your issue?” | Identifying friction in support processes | Doesn’t measure emotional connection |
One of the most common concerns is that the net promoter score doesn’t reveal why customers feel the way they do. The score alone lacks context, which is why follow-up questions are essential to uncover the reasons behind customer sentiment and turn the data into meaningful insights.
Net Promoter Score (NPS) measures how likely customers are to recommend a company’s product or service. Employee Net Promoter Score (eNPS) uses the same method but focuses on how likely employees are to recommend their workplace to others.


