

 In this page

TL;DR: The eight knowledge base metrics to track are engagement rate, top content read share, estimated ticket deflection, search success rate, article helpfulness, content freshness, article attach rate, and zero-result search rate. Each metric includes a formula, benchmark guidance, and actions for improving performance.
Knowledge base metrics help support teams measure self-service performance, identify content gaps, and understand how effectively customers find answers.
The right KPIs reveal which articles drive successful outcomes, where users encounter friction, and which areas need improvement.
Combined with effective reporting and analytics, these insights support better content decisions and a more efficient support experience.
In this blog, we’ll explore eight knowledge base metrics to track, how to calculate them, what the results mean, and how to improve each metric.
What are knowledge base metrics?
Knowledge base metrics are measurable KPIs used to evaluate content performance, search effectiveness, user engagement, content freshness, and support impact.
These metrics provide data-driven insight into how users interact with knowledge base content and help teams identify opportunities for improvement.
Why knowledge base metrics matter
Tracking knowledge base metrics helps teams move beyond assumptions and use data to understand how effectively their knowledge base content supports users and contributes to overall support performance.
The following are some of the benefits of tracking these metrics:
- Shows whether users can find answers successfully: Knowledge base metrics reveal whether users can quickly locate relevant information and complete their intended tasks, helping identify content gaps, navigation issues, and unclear explanations.
- Helps identify the knowledge base’s impact on ticket volume: Analyzing knowledge base KPIs alongside ticket trends helps estimate deflection impact and understand whether content is helping reduce repetitive support requests.
- Provides actionable insights for content optimization: Internal search queries, page views, time on page, and engagement signals highlight high-demand topics, confusing articles, and opportunities to improve content quality.
- Helps maintain content accuracy and relevance: Tracking update frequency and user feedback ensures articles remain aligned with product changes, policy updates, and evolving customer needs.
- Supports agent productivity: Monitoring how often agents reference or reuse articles shows whether the knowledge base is helping teams respond more efficiently and consistently.
Together, these metrics provide a data-driven framework for evaluating content performance, identifying improvement opportunities, and maintaining a knowledge base that remains useful, discoverable, and aligned with user needs.
Because performance varies by audience, product, and knowledge base maturity, establish an internal baseline for each metric and monitor changes over time rather than relying on universal targets.
Knowledge base metrics you should be monitoring
1. Knowledge base engagement rate
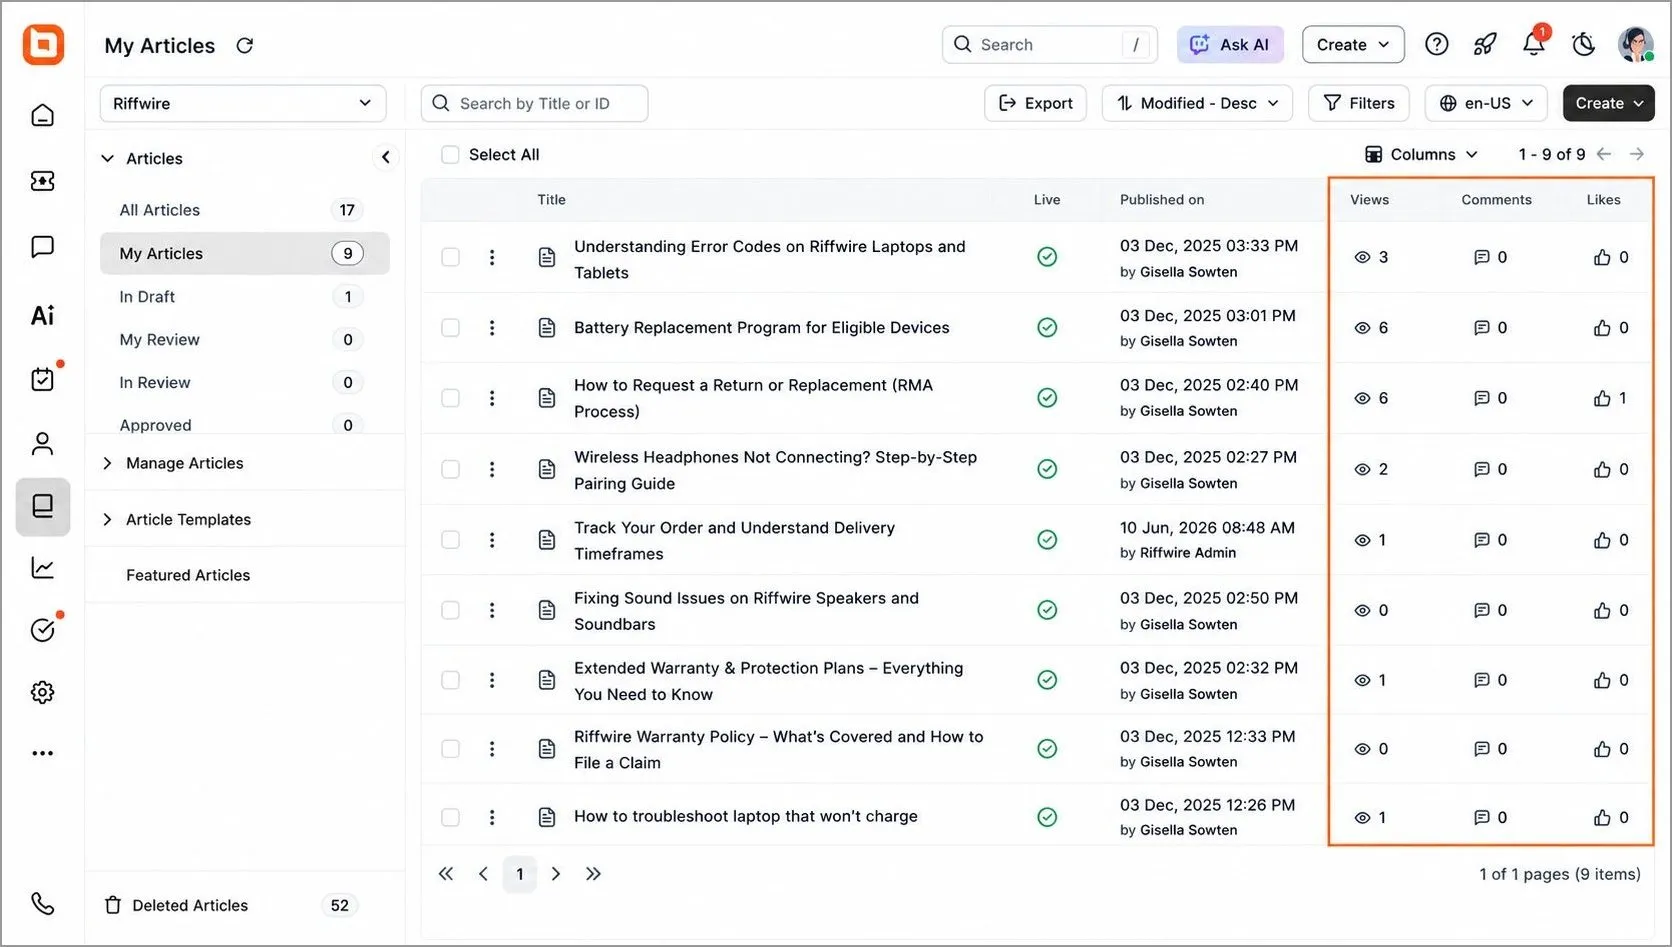
Engagement shows how frequently users access your content and how meaningfully they interact with it through signals such as unique visits, time on page, and scroll depth.
Pageviews alone don’t prove resolution, but they do show interest and discovery patterns.
How to calculate it:
Define an engaged session based on the analytics platform you use, such as a minimum time threshold, scroll depth, or another meaningful interaction.
Growing unique visits, steady time on page, and fewer repeat searches indicate that users are finding the answers they need and engaging meaningfully with your content.
Low engagement may indicate that content is difficult to find or does not align with user needs.
If engagement is high but resolution is low, strengthen step clarity, add expected results, reduce text density, and evaluate whether the article solves the right job.
Benchmark guidance: There is no universally accepted benchmark for knowledge base engagement rate because organizations define engagement differently. Establish an internal baseline and aim for consistent improvement in engaged sessions over time.
2. Top content read share
Article popularity metrics reveal which articles attract the most attention and help uncover your users’ primary intents.
Well-performing popular articles align with high‑volume customer issues, receive positive feedback, and lead to fewer escalations after reading.
How to calculate it:
Track the top 5 or top 10 articles consistently from one reporting period to the next to ensure meaningful comparisons.
A high concentration of views on top articles suggests they are attracting significant user interest and addressing common questions, while a low concentration may indicate that engagement is spread across many articles or that users are struggling to find the most relevant content.
When these pages draw heavy traffic but users still seek support, it indicates the article is discoverable but not resolving the issue, or the title is attracting the wrong intent.
Improve task flows, simplify structure, split complex topics into smaller articles, and update titles and intros to match the search intent behind the clicks.
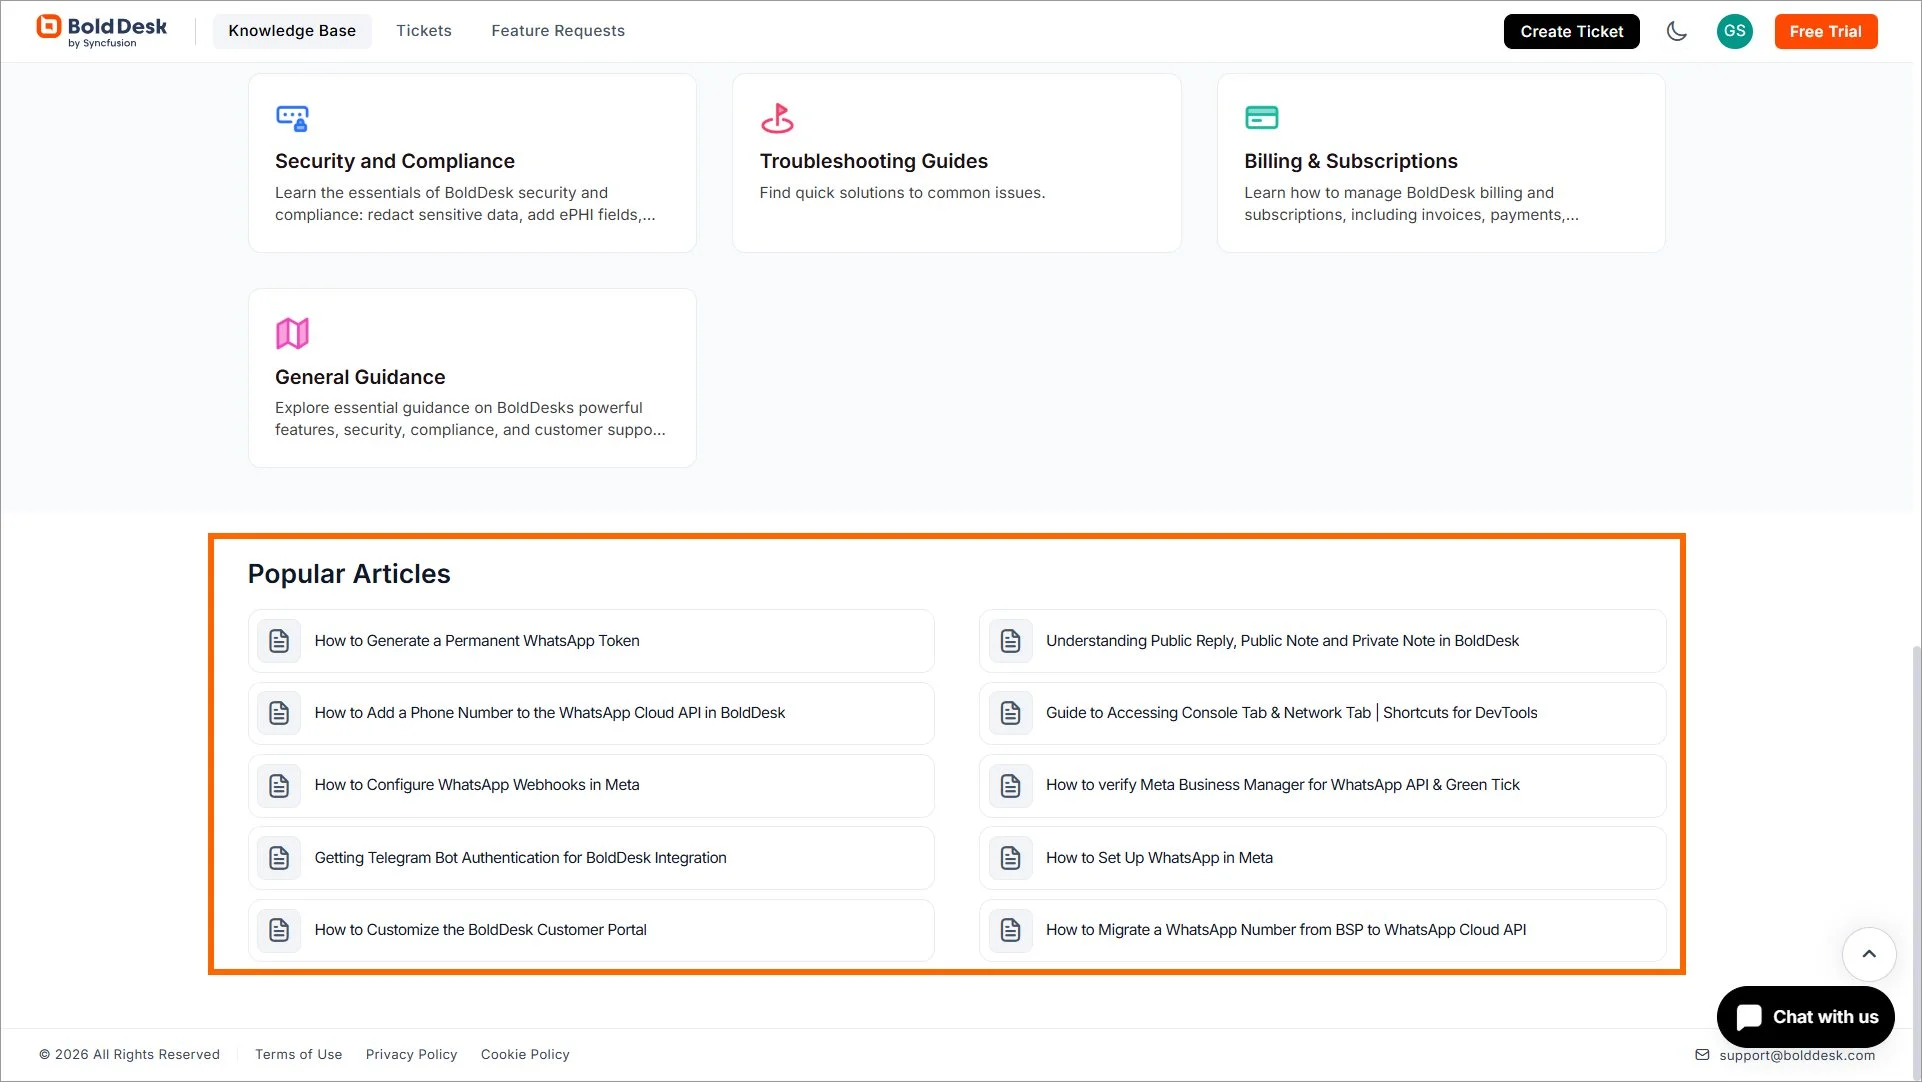
Benchmark guidance: There is no industry-standard benchmark for top content read share because results depend on knowledge base size, content structure, and customer demand. Use historical trends to determine whether high-traffic articles effectively address common issues.
3. Estimated ticket deflection rate
This KPI compares knowledge base usage with ticket volume to estimate whether knowledge base content is helping reduce the load on your support team.
It can also be used alongside other self-service help desk metrics to evaluate how effectively customers resolve issues without agent assistance.
Healthy trends show knowledge base traffic increasing while support ticket volume either stabilizes or drops for known issues.
How to calculate it:
Knowledge base content may be helping users find answers without escalating to support.
Users may be visiting articles but still requiring assistance through support channels.
When traffic grows but ticket numbers don’t change, this indicates that users are visiting the articles but not resolving their issues.
Strengthen search relevance, update low‑rated high‑traffic content, and add in‑product KB links that lead directly to the most helpful pages.
Note: A session without a ticket does not necessarily mean the issue was resolved. This metric should be treated as an estimate unless a resolution signal is captured.
Benchmark guiudance: Ticket deflection rates vary significantly depending on industry, support volume, and measurement methodology. Compare results against your own historical performance and monitor trends over time.
4. Search success rate
Knowledge base KPIs such as search volume, click-through rate on results, reformulations, and overall search success rate reveal how effectively users can locate relevant content.
How to calculate it:
Search success rate = (Searches that lead to article engagement ÷ Total searches) × 100
A strong search experience has high click-through rates on results, low reformulation behavior, and searches that regularly lead to article engagement.
Users may be encountering irrelevant rankings, unclear titles, missing synonyms, or content gaps.
If users frequently search but don’t engage with the results, refine titles, add synonyms, improve tagging, and adjust search ranking so the best content appears first. Use recurring failed queries to prioritize new articles.
Benchmark guidance: There is no universally accepted benchmark for search success rate because organizations define success differently. Strong performance is typically characterized by high engagement with search results and low query reformulation rates.
5. Article helpfulness ratio and article CSAT
Feedback metrics capture how users rate the usefulness of your content through “Was this helpful?” votes or CSAT micro-surveys.
These insights reveal whether articles genuinely solve the problem or need improvement.
How to calculate it:
Helpfulness ratio = (Positive votes ÷ Total votes) × 100
Article CSAT = Sum of all scores ÷ Number of responses
High-performing articles receive strong helpfulness ratings, and negative customer feedback declines after updates.
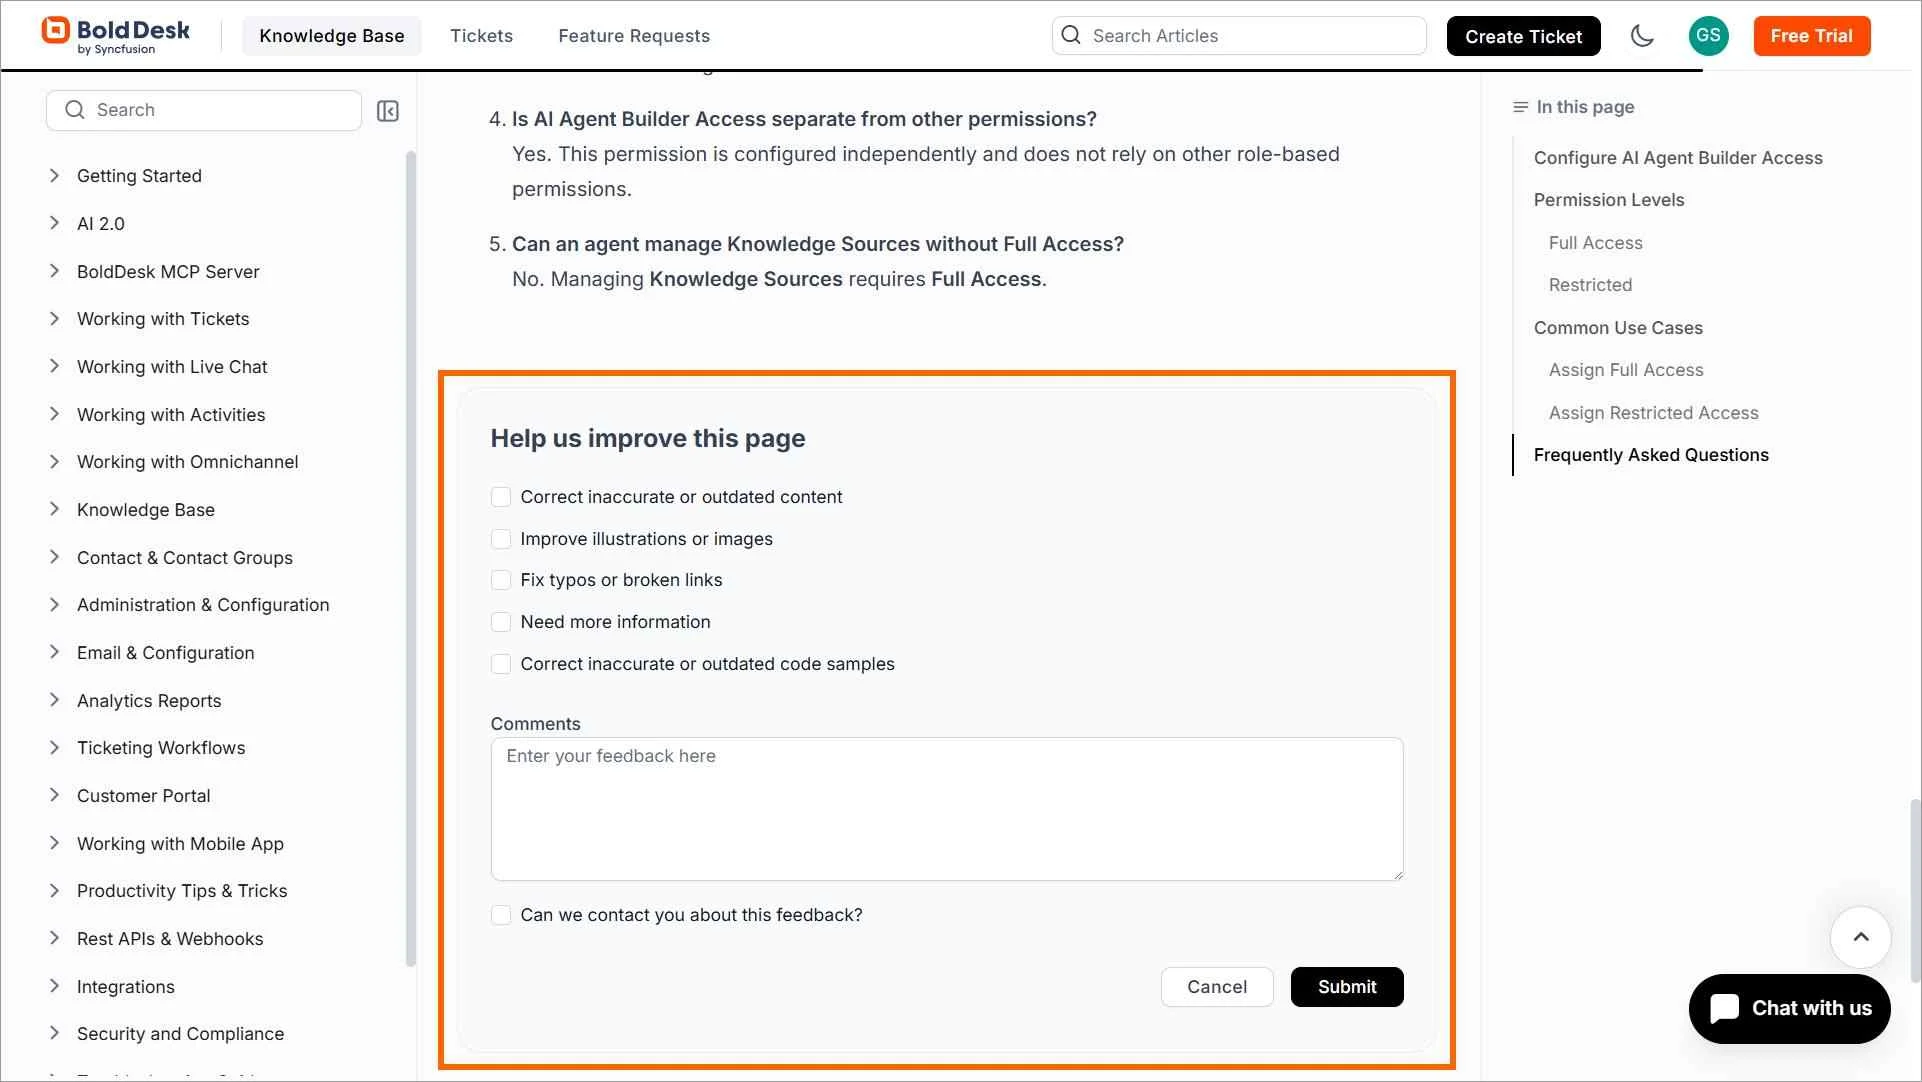
Low ratings may indicate that the article is unclear, incomplete, outdated, or attempting to serve multiple intents.
When traffic is high but ratings are low, reorganize steps, add visuals, clarify instructions, add prerequisites and expected outcomes, or split the page into focused subtopics.
What good looks like: KCS programs typically aim for Content Standard compliance of 90% or higher, while consistently falling below 80% may indicate content quality issues. Reuse link accuracy should also remain above 90%. (Consortium for Service Innovation’s KCS v6 Practices Guide)
6. Content freshness and average article age
Freshness metrics indicate whether your content reflects your current product, processes, and user experience.
Up-to-date articles build trust and increase reuse among internal teams. Stale articles, even when popular, can mislead users.
Organizations using dedicated knowledge base software can track many of these metrics automatically.
How to calculate it:
Average article age = Mean number of days since the last update
Freshness coverage = (Articles updated within your review window ÷ Total articles) × 100
A structured review schedule with a rising percentage of recently updated content indicates that your knowledge base remains aligned with product evolution and customer needs.
Highly visited but rarely updated content may no longer match the current experience, leading to confusion and unnecessary tickets.
Refresh steps, update screenshots, add release-specific notes, or redirect users to the correct version to prevent outdated guidance from being circulated repeatedly.
What good looks like: Follow a reuse-driven review process where articles are reviewed whenever they are reused or updated. For operational governance, organizations often review high-traffic or critical content every 90 days and assess lower-priority content annually. (Reuse is Review)
7. Article link or attach rate
This metric measures how often agents reference, link to, or reuse knowledge base articles while responding to tickets.
How to calculate it:
Link (attach) rate = (Tickets with at least one article link ÷ Total tickets) × 100
High reuse indicates the knowledge base is trusted, accurate, and aligned with real support workflows.
Low reuse may indicate that content is difficult to find, not written in an agent-friendly format, or does not match real support scenarios.
Enhance internal versions with agent-only notes, include copy-ready snippets for responses, and coach teams to link articles when resolving cases so improvement cycles continue.
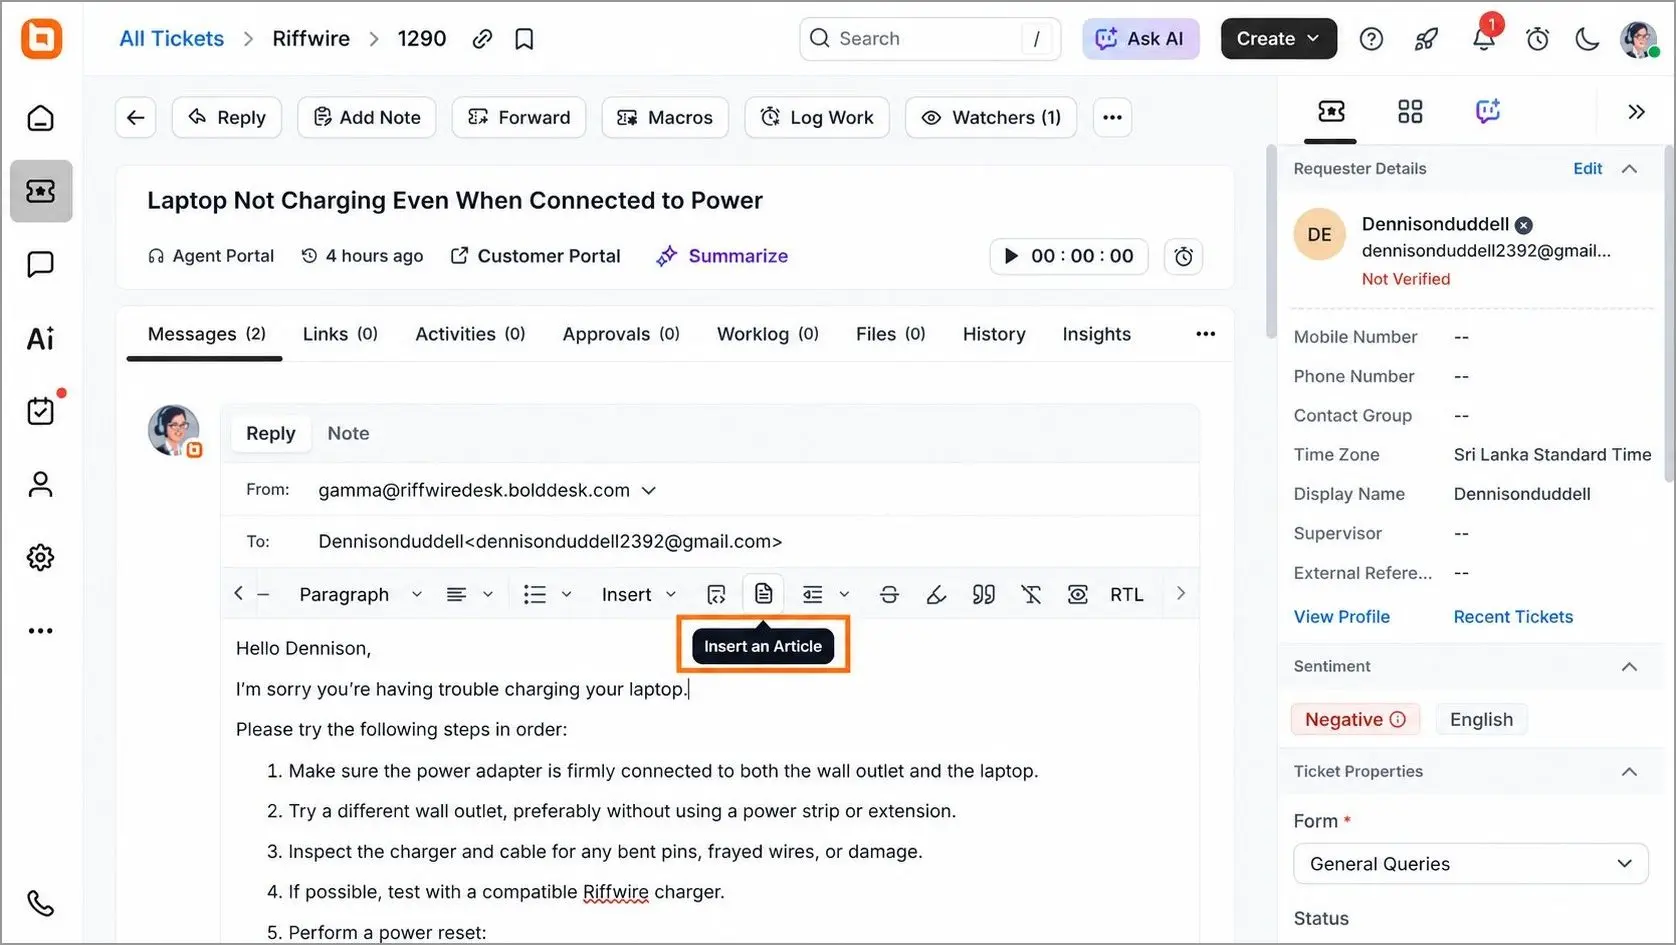
What good looks like: Mature self-service programs should achieve a greater than 50% probability of customers finding helpful information through self-service, while internal knowledge reuse should meet or exceed the rate at which new articles are created. (Consortium for Service Innovation, Self-Service Success)
8. Zero‑result search rate
Zero-result search rate measures how often users enter queries that return no results.
Unlike general search performance KPIs, this metric specifically highlights missing content, terminology mismatches, or indexing gaps.
How to calculate it:
Zero-result rate = (Number of no-result searches ÷ Total searches) × 100
A high zero-result rate indicates that users are searching for information that doesn’t exist, is labeled differently from the language they use, or isn’t indexed or tagged correctly.
A low zero-result rate suggests that users are generally finding matching content for their searches and that knowledge base coverage aligns well with user needs.
Create new articles for recurring terms, add synonyms that match user phrasing, and refine tagging and metadata to improve discoverability.
What good looks like: Many site-search benchmark studies report zero-result rates around 5% to 6%. Knowledge bases should generally aim to keep zero-result searches in the low single digits and investigate rates consistently above 10%. (Prefixbox 2024 Search Benchmark Report)
Leveraging knowledge base metrics to improve self-service
Tracking your help center metrics gives you a simple way to understand what’s working, what needs attention, and where customers may still struggle.
This enables you to steadily refine your content, so users get reliable answers faster while reducing repetitive tickets.
With BoldDesk, you don’t have to guess. Its built‑in analytics, search insights, and content performance dashboards make it easier to spot trends, close gaps, and keep your content consistently helpful.
Ready to strengthen your self‑service experience? Start a free trial or book a live demo.
If you have thoughts or want to share how you track your own KB success, feel free to share in the comment section below.
Related articles
- 7 Important Tips to Creating a Knowledge Base Effectively
- 10+ Essential Customer Engagement Metrics to Track
- 11 Help Desk Metrics to Improve Customer Service (2026)
FAQs on Knowledge base metrics
This usually happens when articles lack clarity, don’t match user intent, or miss key steps.
Updating instructions, adding screenshots, or refining titles based on search terms can significantly improve article effectiveness.
Review high-impact articles more frequently than stable content, and update them whenever related products, policies, or processes change.
Stale or outdated content can lead to customer confusion and increased tickets.
A zero-result search occurs when users search for something and find no matching articles.
High zero-result rates indicate missing content or poor labeling, making it a critical knowledge base metric for identifying content gaps.