





TL;DR: Help desk metrics reveal how well support teams perform by highlighting response times, workload trends, customer satisfaction, and SLA compliance. Monitoring these KPIs helps you optimize workflows, resolve issues faster, and deliver a more consistent customer experience.
Modern businesses rely on help desk software to deliver fast, reliable support, yet many lack clear insight into what’s holding performance back.
Even with the right tools in place, gaps in visibility can hide bottlenecks across triage, response, and resolution.
The result is predictable: slower response times, missed SLAs, frustrated customers, and decisions based on guesswork instead of data.
Tracking the right help desk metrics gives teams clear visibility into where support operations slow down and where improvements are needed.
You can spot where work slows down, validate service quality, understand customer sentiment, and continuously improve support efficiency and consistency.
This guide breaks down the key help desk metrics you should track, how to interpret them, and best practices for using them to improve results.
What are help desk metrics?
Help desk metrics are measurable data points used to track how effectively a support team or help desk handles customer requests across speed, quality, and efficiency.
They help teams monitor performance against SLAs, identify bottlenecks, and improve the customer support experience.
Common help desk metrics include first response time, time to resolution, ticket volume, SLA breach rate, and ticket backlog.
What’s the difference between a metric and a KPI?
A metric is any number you track to understand what’s happening in your help desk. For example, ticket volume, first response time, and average resolution time are all metrics.
A KPI (Key Performance Indicator) is a metric that directly measures progress toward a specific goal.
Simply put, metrics help you monitor performance, while KPIs help you measure success against your goals. All KPIs are metrics, but only the most important metrics become KPIs.
Note: Help desk metrics focus on operational support performance, including ticket handling, response times, resolution efficiency, and SLA compliance. For broader customer experience measures such as CSAT, NPS, and customer loyalty, see our guide on customer service metrics.
Types of help desk performance metrics
Help desk metrics can be grouped into key categories based on what they measure, helping teams evaluate performance from different perspectives.
They are commonly divided into four categories, including:
Agent performance metrics
These metrics examine how individual agents and teams contribute to overall help desk outcomes.
They are commonly used to identify coaching opportunities, workload imbalances, and process gaps.
Examples include:
- Tickets handled per agent
- First response time
- Average handle time
Customer impact (quality) metrics
Customer impact metrics reflect how support performance is perceived by customers and whether interactions build satisfaction, trust, and long‑term retention.
These metrics highlight the effectiveness, not just the speed, of support.
Examples include:
- Customer Satisfaction Score (CSAT)
- First Contact Resolution (FCR)
- Customer feedback ratings (post‑ticket surveys or reviews)
Financial impact metrics
Financial impact metrics link help desk performance to cost control, efficiency, and business value.
These metrics are especially useful for budgeting discussions and help desk ROI analysis.
Examples include:
- Cost per ticket
- Support cost trends (month‑over‑month or quarter‑over‑quarter)
- Efficiency gains from faster resolutions (time saved)
Productivity (volume and efficiency) metrics
Productivity metrics focus on how efficiently incoming support requests are handled, including ticket flow, workload balance, and overall throughput.
They help teams understand demand patterns and ensure work is progressing at a sustainable pace.
Examples include:
- Tickets created vs. tickets resolved
- Ticket backlog size (open tickets)
- Average resolution time
Essential help desk metrics to track support teams’ performance
Tracking the right customer support metrics and KPIs allows teams to measure efficiency, monitor service quality, and improve customer experience.
The following key help desk KPIs focus on ticket volume, response times, customer satisfaction, and SLA compliance, making it easier to identify what’s working and where improvements are needed.
Ticket volume
Ticket volume measures the total number of support requests received during a specific time period, such as daily, weekly, or monthly.
Ticket volume is influenced by factors such as customer base size, product changes, seasonal demand, and the availability of customer self‑service resources.
Effectively managing ticket volume allows teams to plan staffing levels, balance workloads, and maintain consistent response times as demand fluctuates.
Target: According to HDI benchmark data, organizations typically receive 0.54-1.38 tickets per user per month, depending on industry. Tracking ticket volume helps teams anticipate workload and allocate resources effectively.
How to calculate it:
Count the total number of tickets received during a specified period.
Ticket Volume = Total number of tickets received during a specific period
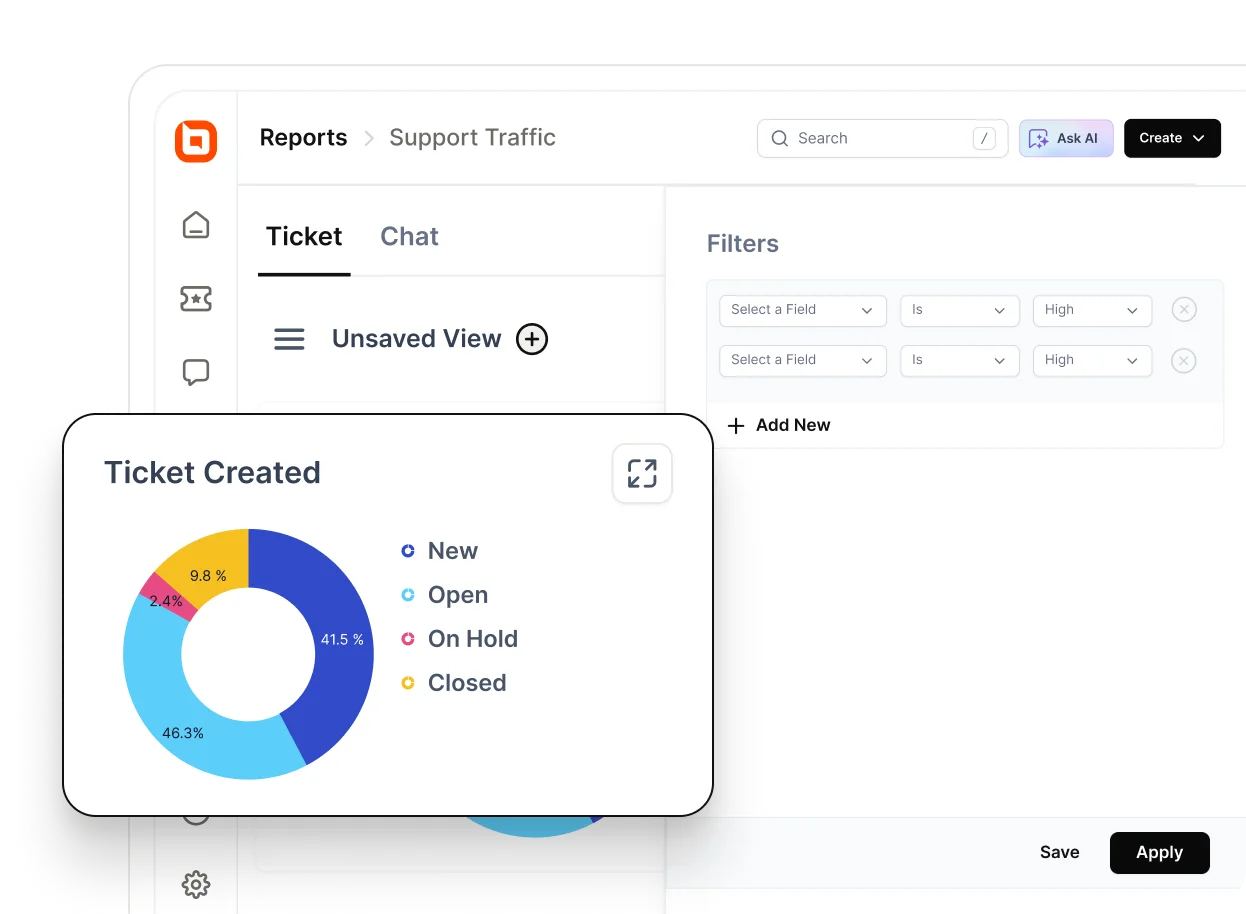
Support tickets created vs. closed
This metric compares the number of tickets created with the number of tickets resolved within the same time frame. It reflects how well the support team is keeping up with incoming demand.
When tickets are created faster than they are closed, backlogs grow, response times increase, and customer satisfaction often drops.
Target: Maintain a ratio of 1:1 or better, meaning tickets resolved should match or exceed tickets received.
A healthy balance indicates stable operations and effective help desk management.
How to calculate it:
Divide the total number of tickets closed by the total number of tickets created during the same period.
Tickets Created vs. Closed = Total tickets closed ÷ Total tickets created
Worklog
Worklog tracks the time agents spend working on support tickets, including when work was performed and how long it took. This metric captures the effort behind ticket resolution, not just the outcome.
Worklog data provides visibility into workload distribution, identifies time‑consuming issue types, and highlights inefficiencies in processes or tools.
By reviewing worklog trends, managers can better assign tickets, improve support workflow optimization, and ensure agents are spending time where it adds the most value.
Target: According to Endsight benchmark data, support teams spend an average of 63 minutes per ticket, making it a useful benchmark for evaluating agent workload and support efficiency.
How to calculate it:
Add up the total time logged by agents across all tickets during a given period.
Worklog Time = Total time logged by agents on tickets
Response overdue
Response overdue measures the number or percentage of tickets that did not receive a response within the defined response time.
This metric highlights where customers are left waiting longer than expected, which can quickly lead to frustration and reduced trust.
High overdue counts often point to staffing gaps, inefficient routing, or unclear response targets.
Reducing overdue tickets requires improving first response times in customer service and ensuring tickets are prioritized correctly.
How to use it: According to Forrester, customers are 2.4 times more likely to stick with a brand when their problems are solved quickly.
How to calculate it:
Count the total number of tickets that exceeded the defined response time without an agent reply.
Response Overdue = Total tickets exceeding the defined response time
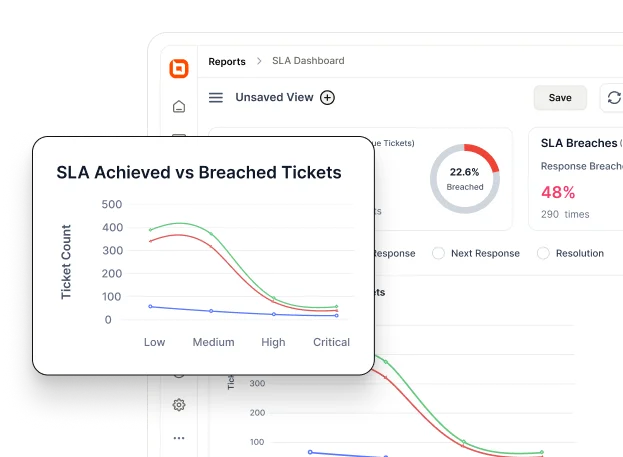
SLA breach rate
SLA breach rate measures the number of tickets that were not resolved within the timelines promised in service level agreements.
Target: According to a report by Supportman, high-performing support teams typically maintain 95%+ SLA compliance, while world-class teams achieve 98%+.
This equates to an SLA breach rate below 5% and below 2% for top-performing teams.
Frequent help desk SLA breaches can damage customer relationships and lead to contractual risks, especially in B2B customer service.
How to calculate it:
Divide the number of SLA breach tickets by the total number of SLA‑tracked tickets.
SLA Breach Rate (%) = (Breached SLA tickets ÷ Total SLA-tracked tickets) × 100
Replies per contact
Replies per contact measures how many responses a customer sends before an issue is resolved.
A high number of replies often indicates unclear explanations, incomplete resolutions, or complex issues that require multiple back‑and‑forth interactions.
Monitoring this metric improves communication clarity and enables faster issue resolution with fewer interactions.
Target: Maintain a low replies-per-contact rate by resolving issues with minimal back-and-forth interactions while ensuring customers receive complete and accurate solutions.
How to calculate it:
Divide the total number of customer replies by the number of resolved tickets.
Replies Per Contact = Total customer replies ÷ Total resolved tickets
Busiest time of day
The busiest time of day identifies when ticket creation and customer activity peak throughout the day.
Understanding peak hours ensures adequate coverage during high demand and prevents understaffing during critical periods.
How to use it: Use busiest-time trends to align staffing with demand, maintain response-time targets, and prevent ticket queues during in-demand support hours.
How to calculate it:
Analyze ticket creation and reply volume across time intervals to identify peak activity periods.
Busiest Time = Time period with the highest ticket volume or replies
First Response Time (FRT)
First response time measures the time taken between a customer submitting a support ticket and receiving the first reply from a support agent.
This metric is influenced by factors such as ticket volume, agent availability, and support workflows.
First response time directly affects customer perception and trust. Faster responses reassure customers that their issue is being handled, while long wait times often lead to frustration, lower satisfaction scores, and repeat follow‑ups.
Target: According to MetricHQ, first response time benchmarks vary by support channel. A good target is under 3 minutes for phone support, under 1.5 minutes for live chat, and within 24 hours for email and ticketing systems.
How to calculate it:
Add up the total time taken to send first responses and divide it by the number of tickets.
FRT = Total first reply time during the selected period ÷ Total number of resolved tickets
Escalation rate
Escalation rate measures the percentage of tickets that require transfer from first‑level support to higher‑level teams.
High escalation rates may indicate complex issues, ineffective ticket routing, or insufficient frontline training. Lower rates typically reflect a well‑prepared and empowered first‑line support team.
Tracking this metric helps improve training, knowledge access, escalation management, and issue categorization.
Target: According to Count benchmark data, SaaS B2B support teams typically maintain an escalation rate between 15% and 25%, making it a useful benchmark for evaluating frontline resolution effectiveness.
How to calculate it:
Divide the number of escalated tickets by the total number of tickets received.
Escalation Rate = Number of escalated tickets ÷ Total number of tickets
Reopen rate
Reopen rate measures the percentage of resolved tickets that are reopened because the original issue was not fully addressed or the customer requires additional assistance.
A high reopen rate indicates resolution quality issues, gaps in troubleshooting procedures, unclear communication, or insufficient knowledge resources.
Lower reopen rates generally suggest that support teams are resolving issues correctly the first time and providing complete solutions.
Target: According to Endsight’s help desk metrics benchmark data, organizations reopen an average of 5.4% of tickets. This benchmark provides a useful reference point for evaluating resolution quality and identifying opportunities to improve support processes.
How to calculate it:
Divide the number of reopened tickets by the total number of resolved tickets and convert the result to a percentage.
Reopen Rate = (Number of Reopened Tickets ÷ Total Number of Resolved Tickets) × 100
Average Resolution Time (ART)
Average resolution time measures the average time it takes to fully resolve a support ticket from the moment it is created until the issue is closed.
This metric helps support teams evaluate overall efficiency and identify bottlenecks in the resolution process.
Target: According to TextExpander, average resolution time benchmarks vary by channel, with live chat averaging 5-10 minutes and phone support 10-60 minutes.
How to calculate it:
Divide the total time spent resolving all tickets by the total number of resolved tickets during a specific period.
Average Resolution Time = Total Resolution Time for All Resolved Tickets ÷ Total Number of Resolved Tickets
Pro tip: Focus on 5-7 KPIs that align with your primary support goals rather than tracking every available metric. A smaller set of meaningful KPIs makes it easier to identify trends, prioritize improvements, and take action based on the data.
Best practices for implementing help desk metrics
In highly competitive markets where products, services, and pricing look similar, customer service becomes a key differentiator.
According to Salesforce research, 92% of consumers are more likely to make another purchase after a positive service experience.
Use the tips below to effectively integrate help desk KPIs into your customer service operations.
Begin by determining the outcome you want to achieve with your help desk metrics. Is it to improve response time, increase customer satisfaction, or reduce costs?
Then define the current performance, the target (what “good” looks like), the timeframe (e.g., 30, 60, or 90 days), and the owner (who is accountable).
Select suitable help desk performance metrics that align with your support model and customer expectations.
While it’s important to keep track of quantitative metrics like the number of tickets resolved, don’t ignore qualitative metrics such as customer feedback and satisfaction.
Track a mix of:
- Speed: first response time, time to resolution
- Quality: CSAT, QA score, reopen rate
- Volume or efficiency: ticket volume trends, backlog, cost per ticket
Use your help desk reporting and analytics to automate metric tracking and generate real-time reports, ensuring teams can monitor performance without manual effort.
Ensure everyone uses the same definitions, e.g., what counts as “first response,” business hours vs 24/7, what triggers a “reopen” so your trends are trustworthy.
Make the help desk performance metrics review routine, including:
- Daily or weekly: Backlog, breaches, response, or resolution trends
- Monthly or quarterly: CSAT drivers, channel performance, staffing need
Each review should end with a decision: what you’ll keep, change, or test next.
Regular revision also ensures that the service desk metrics remain relevant to evolving business needs, changes in technology, and customer expectations.
Compare your help desk reporting metrics with industry standards to understand how you’re performing relative to your competitors.
Benchmarks vary by:
- Industry e.g., SaaS and ecommerce
- Support hours e.g., business hours or 24/7
- Ticket complexity and channels e.g., chat, email, or phone
Share your help desk metrics with your team and other stakeholders so they understand how performance is being measured, where they stand, and what they need to do to improve.
Focus on coaching and process fixes like training, help desk macros, routing, and knowledge base gaps.
This helps agents make necessary adjustments to their approach to improve overall performance.
Turning help desk metrics into better customer experiences
When used effectively, help desk metrics become a powerful tool for improving efficiency, reducing response times, and delivering better customer experiences.
These KPIs give support teams the visibility they need to make data‑driven decisions, identify areas for improvement, and consistently meet customer expectations.
By monitoring key performance indicators, businesses can transform their help desk operations from reactive to proactive, ensuring smoother workflows and higher service quality.
BoldDesk, one of the best help desk software platforms, equips teams with powerful tools to track, analyze, and act on these metrics in real time.
With built‑in dashboards, real‑time reports, and customizable views, you get the insights you need to elevate your support performance.
Get started instantly with a 15‑day free trial to see BoldDesk in action and explore how it can be tailored to your specific needs.
Related articles
- Top 9 Customer Loyalty Metrics to Measure for Success in 2026
- Knowledge Base Metrics: 8 KPIs to Enhance Self-Service
- Top 10 Customer Experience Metrics & KPIs to Measure Success
FAQs on help desk metrics
Yes. Backlog-focused metrics, like open tickets, ticket aging, overdue SLA count, and average ticket resolution time, show where work is piling up and why.
Use them to rebalance staffing, improve routing or triage, prioritize by impact, and remove repeat-ticket drivers.
Help desk metrics turn support activity into actionable data. Tracking KPIs like SLA compliance, first response time, and resolution time helps teams identify trends, remove bottlenecks, improve processes, and make evidence-based staffing and training decisions.
A good first response time depends on the support channel. Phone support is often measured in minutes, live chat in under 1.5 minutes, and email/ticketing systems within 24 hours. Targets should reflect customer expectations and SLA commitments.
The most important help desk metrics depend on your goals, but commonly prioritized KPIs include first response time (FRT), escalation rate, and SLA compliance. These metrics provide a balanced view of speed, quality, and reliability in support performance.